
Charts in Model Views v2.4.0+
Besides standalone dashboards and explores, cube charts can sit right in any Erupt model's view tabs: @Vis(type = Vis.Type.CUBE) declares a grid of charts in code, switched alongside the table, board, map and other views. The list's current search conditions are forwarded as cube filters, so the charts always describe the rows being filtered on screen.
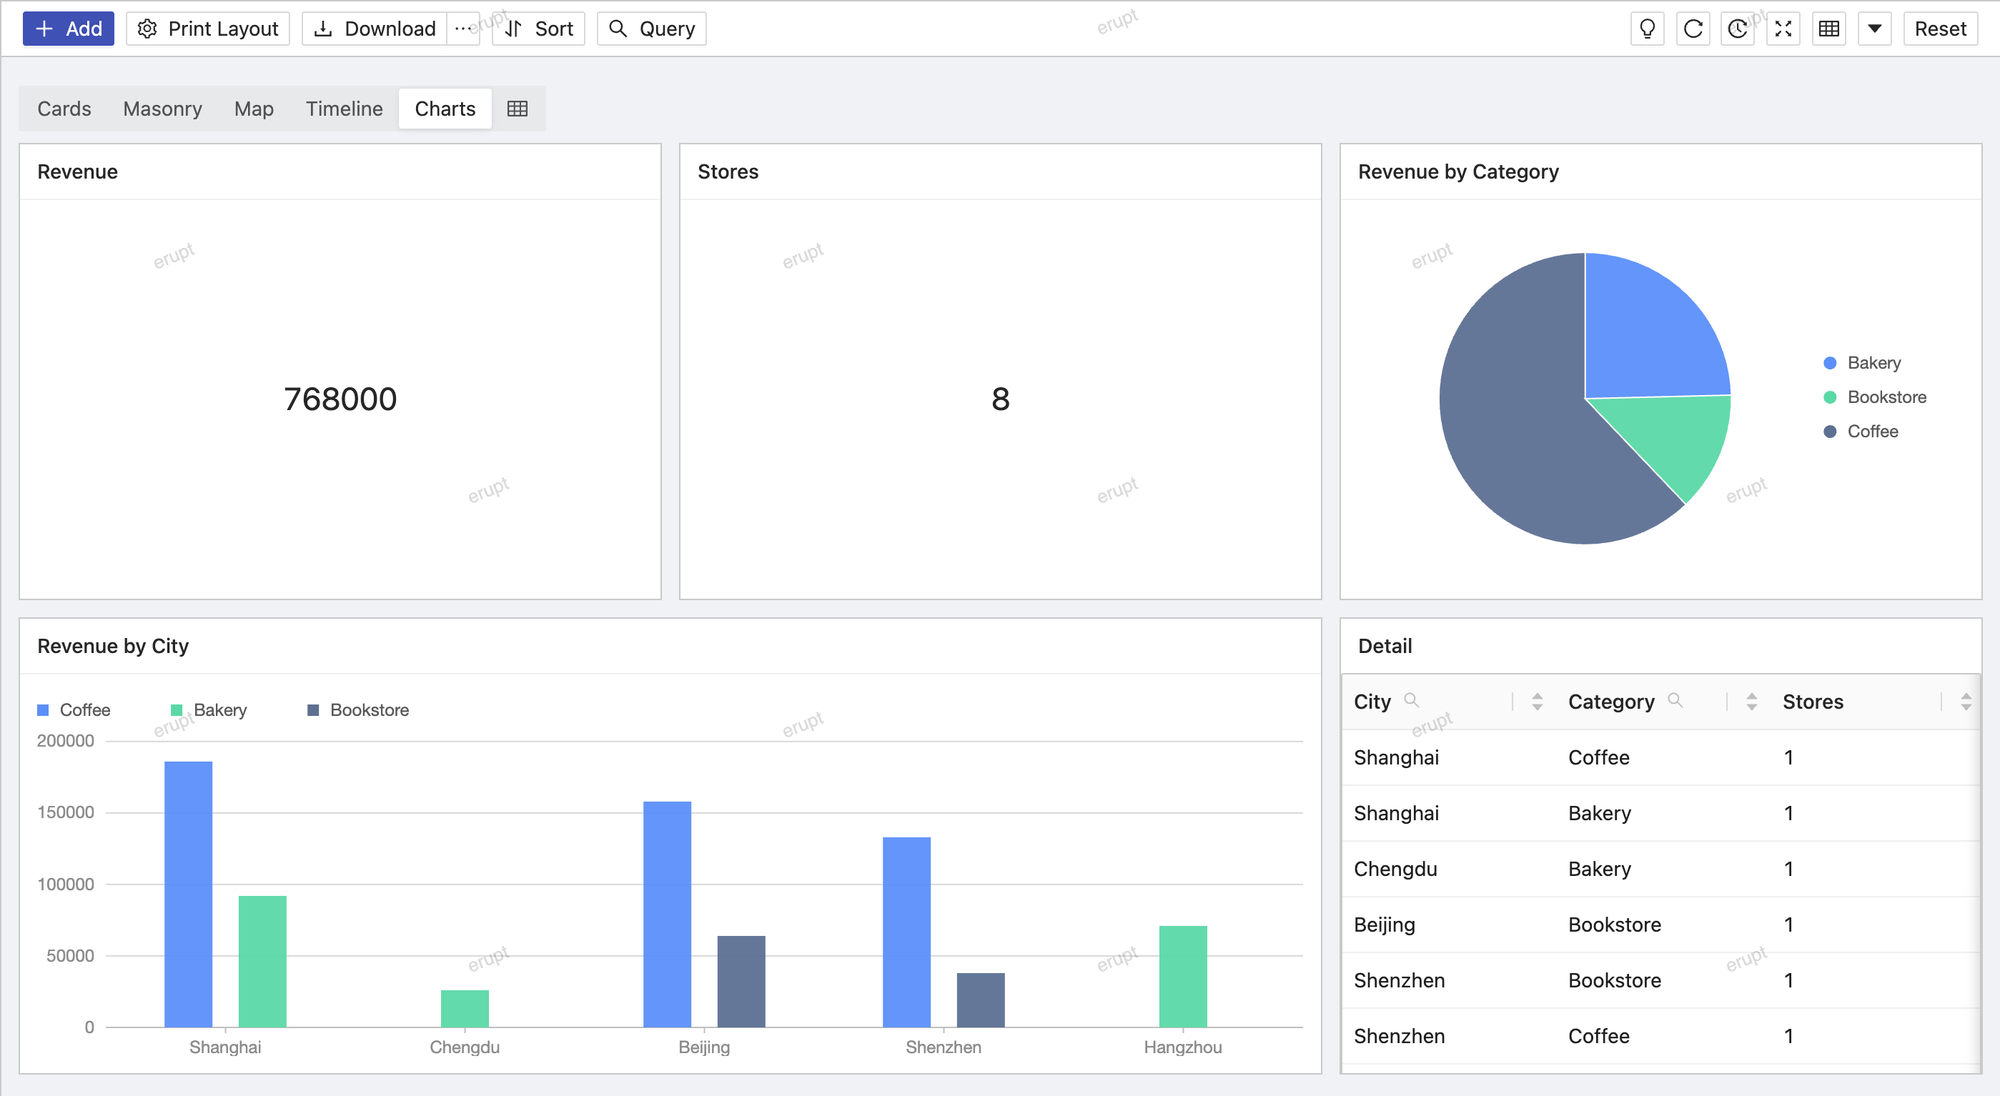
Compared with Dashboards
| Visual analysis dashboard | Charts in model views | |
|---|---|---|
| Defined by | Drag-and-drop design on the page | Annotations on the model class, versioned with the code |
| Entry | A menu of its own | A view tab of the business model's page |
| Filtering | The dashboard's own filters | The list's search bar: what you search is what gets counted |
| Suits | Self-service analysis, cross-model reports | Statistics built into a business page, such as a sales overview on the orders page |
Both query the same @EruptCube semantic model, so the metric definitions agree.
Quick Start
The simplest setup makes the model its own cube: add @EruptCube to the model, mark the fields to aggregate with @Dimension / @Measure, then declare a CUBE view.
java
@Entity
@Table(name = "t_order")
@EruptCube(name = "Order analysis", sql = "t_order", sqlType = SqlType.TABLE_NAME)
@Erupt(
    name = "Orders",
    vis = @Vis(
        title = "Charts",
        type = Vis.Type.CUBE,
        cubeView = @CubeView(charts = {
            @CubeChart(title = "Revenue", type = CubeChart.Type.KPI, y = "amount"),
            @CubeChart(title = "Revenue by channel", type = CubeChart.Type.COLUMN, x = "channel", y = "amount"),
            @CubeChart(title = "Revenue trend", type = CubeChart.Type.LINE, x = "createTime", y = "amount", span = 2)
        })
    )
)
public class Order extends BaseModel {

    @Dimension(title = "Channel")
    @EruptField(views = @View(title = "Channel"), edit = @Edit(title = "Channel", search = @Search))
    private String channel;

    @Dimension(title = "Order time")
    @EruptField(views = @View(title = "Order time"), edit = @Edit(title = "Order time", search = @Search(vague = true)))
    private Date createTime;

    @Measure(title = "Revenue", sql = "sum(amount)")
    @EruptField(views = @View(title = "Amount"), edit = @Edit(title = "Amount"))
    private Double amount;

}
The charts can also query a separate cube class: @CubeView(cube = OrderCube.class, ...).
Interaction
- When the list's search conditions change, every chart queries again; searched fields must be cube dimensions, and
searchMappingmaps names that differ - Clicking a chart element (such as one bar) adds the matching equality filter, shown as a removable tag above the view
- Chart types are the same as the dashboard's report types: KPI, line, column, pie, pivot table and more
See CUBE View for every @CubeView / @CubeChart attribute.
Contributors
 YuePeng