
AI Canvas v2.1.0+
INFO
One sentence turns a semantic model into any presentation. Pick a Cube, describe the page you want, and AI instantly generates a complete page fed by live data — data walls, executive cockpits, leaderboards, trend boards, filterable analysis pages. Whatever you can describe, without writing a line of frontend code.
Erupt Cube integrates deeply with Erupt AI Canvas: the semantic layer makes sure the numbers are right, AI Canvas makes sure they look great. The dimensions, measures, metric definitions and data permissions you defined while modeling become the data foundation of every AI-generated page.
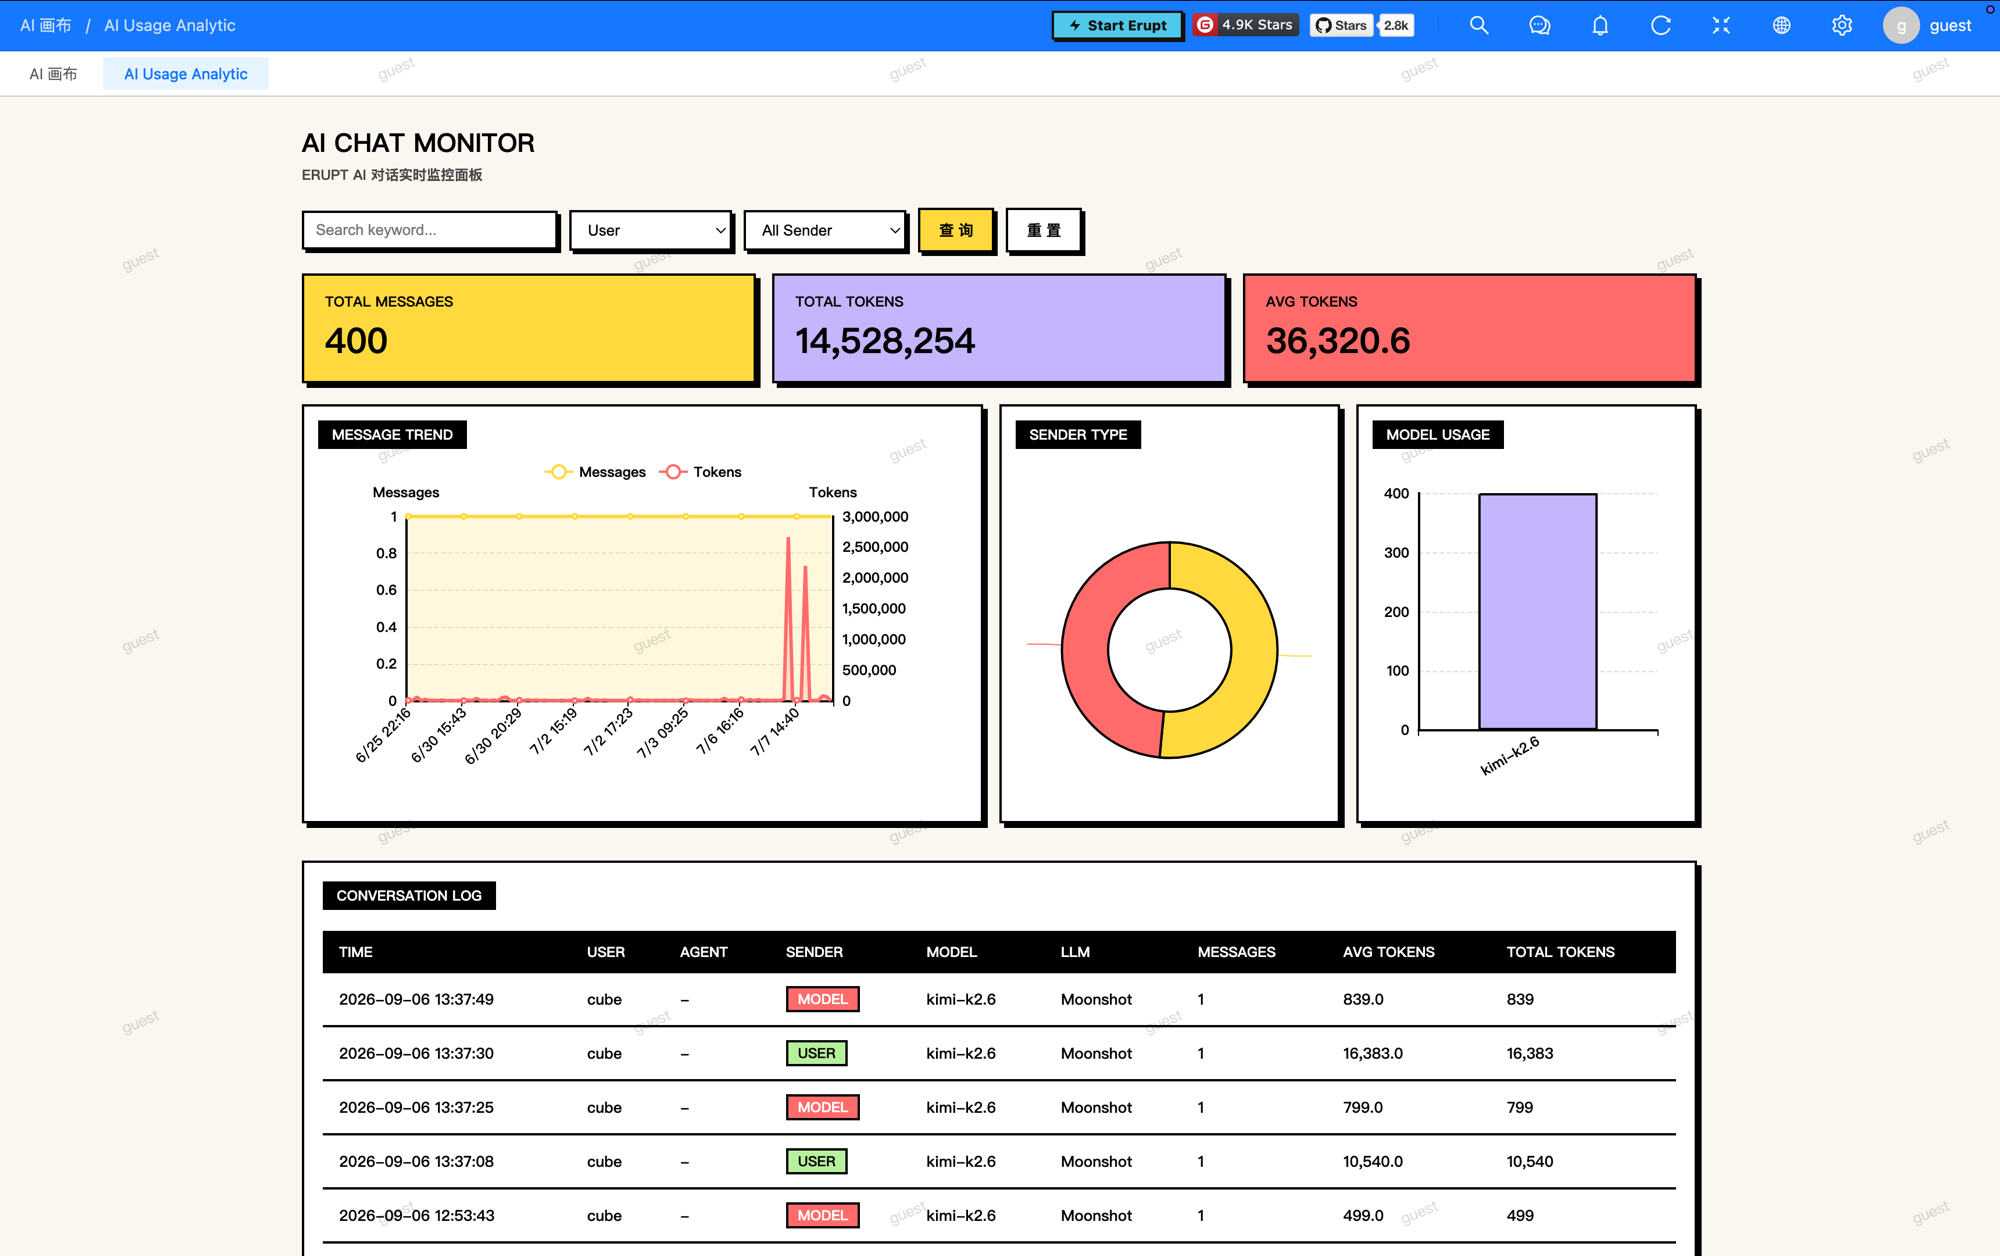
Why AI Canvas
Drag-and-drop dashboards solve "standardized analysis": grid layouts, built-in charts, a consistent look — perfect for day-to-day operational boards. But some pages never fit:
- The CEO wants a dark full-screen wall in the boardroom with real visual impact;
- A business team wants a page built around one specific question, with unusual chart combinations and interactions;
- Summary charts and detail tables must sit on the same page, with click-to-drill linkage;
- The same data needs different styles for different audiences.
All of these used to mean waiting for frontend capacity. Now they take one sentence.
More Than Page Generation: Numbers You Can Trust
The biggest problem with AI page generators is "looks like it works": beautiful charts, made-up numbers. Erupt Cube's AI Canvas is different:
| Guarantee | What it means |
|---|---|
| 🎯 Consistent metrics | Every number on the page comes from the metric semantics pre-defined in @Measure, the same source as drag-and-drop dashboards and AI Query |
| 🔐 Inherited permissions | Pages read data as the visitor, so row-level permissions still apply; once published as a menu, native Erupt permissions take over |
| ✅ Verify before writing | During generation the AI really executes its queries; anything that fails never makes it into the page — no fake charts |
| 🔒 Read-only by design | The cube data source is read-only, so generated pages carry zero write risk |
One Sentence, Many Styles
Same Cube data, one prompt — "generate a new style" — and you get a completely different presentation. Every round is kept as its own version, ready to switch or roll back at any time.
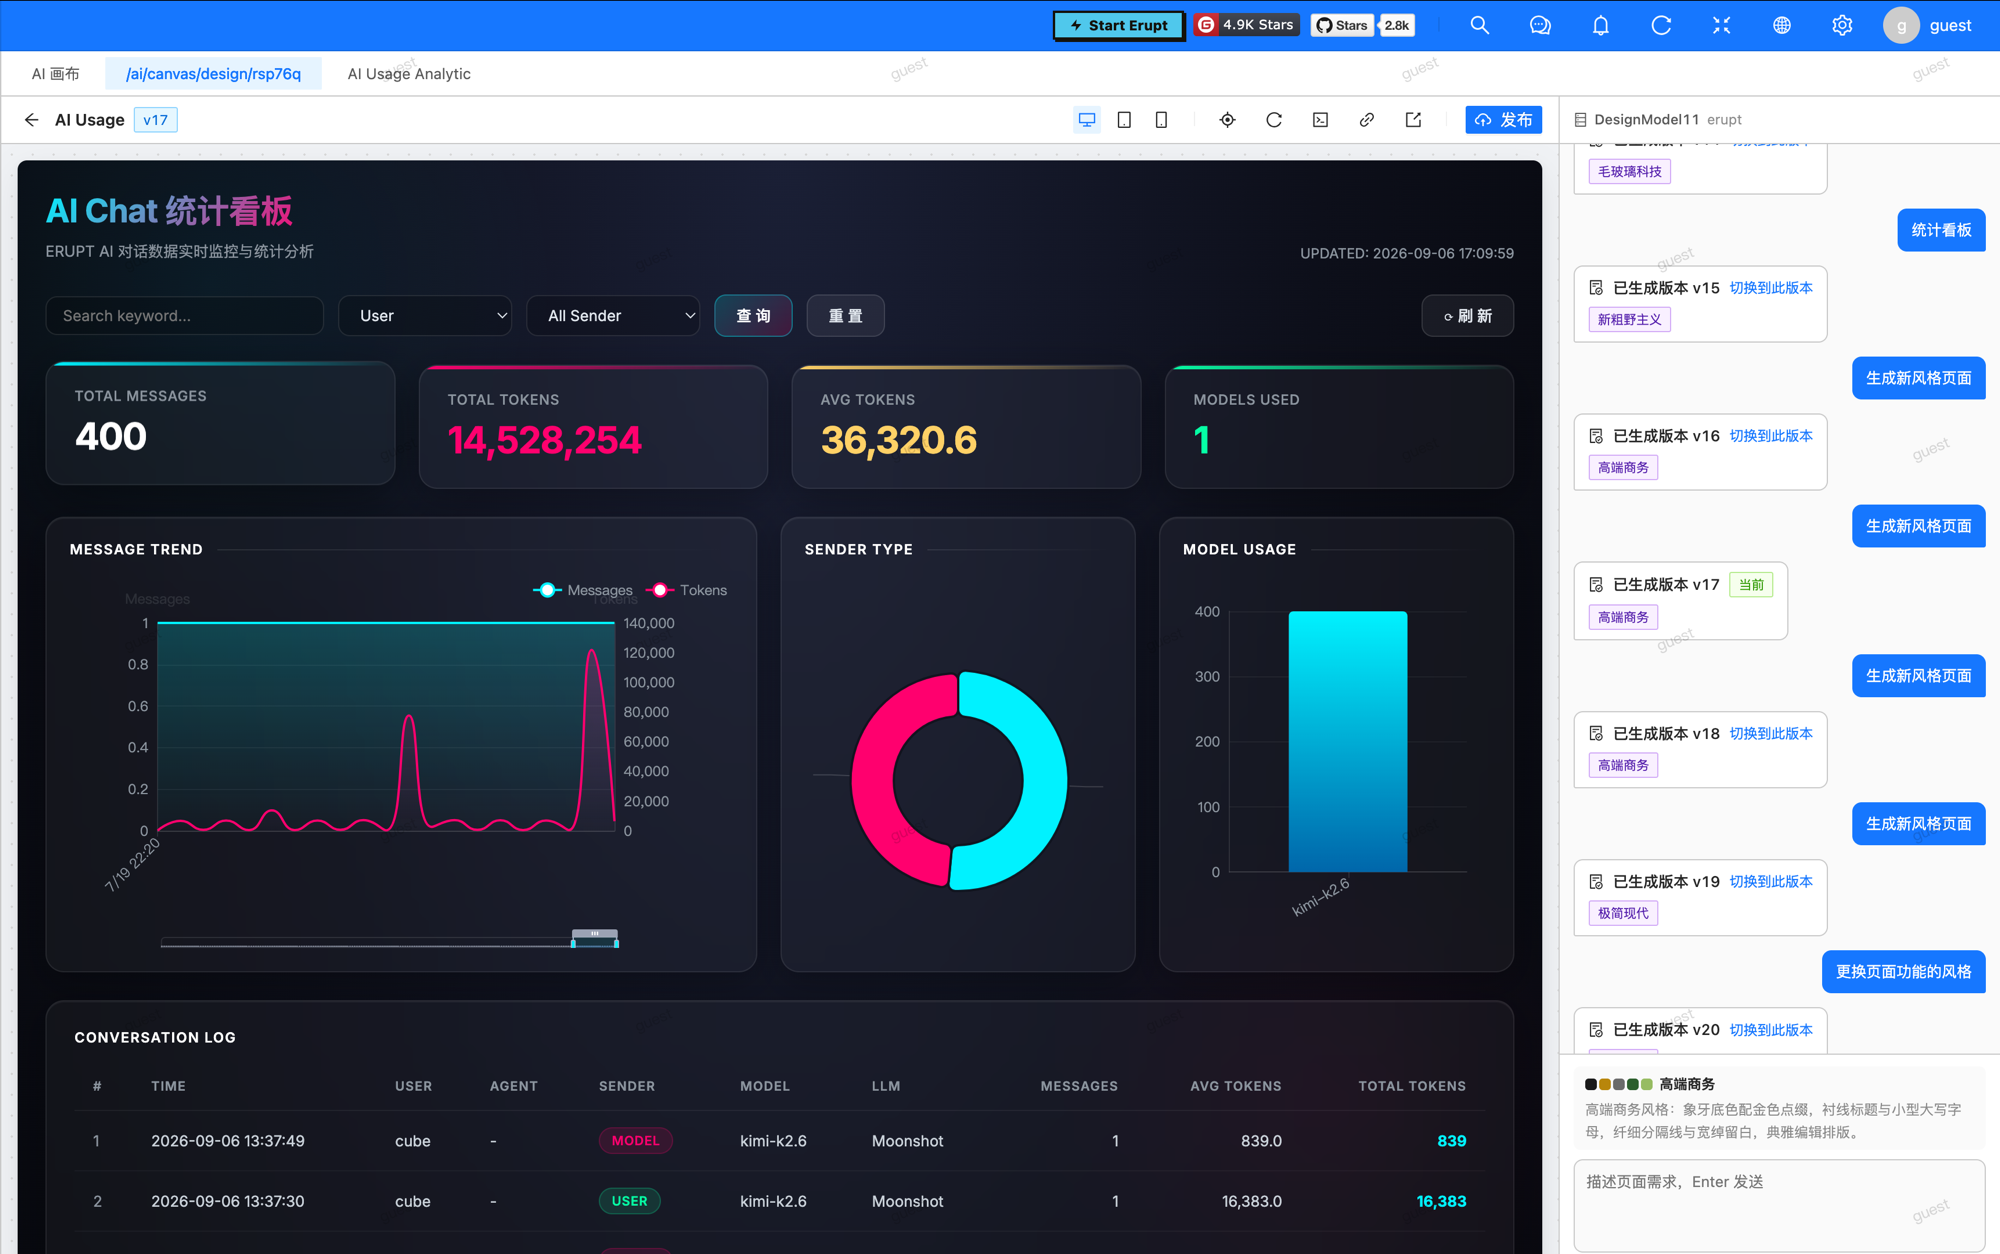
- Streaming generation: watch the page appear character by character, live preview, stop anytime
- Pick-to-edit: click a chart or card on the page and change just that, nothing else moves
- Multi-device preview: desktop / tablet / mobile with one click
- One-click publish: push to the admin menu and it becomes a production page instantly
- Summary + detail on one page: bind a Cube (aggregation) and an Erupt model (details) to the same canvas, each taking its optimal path
Quick Start
1. Add dependencies
<dependency>
    <groupId>xyz.erupt</groupId>
    <artifactId>erupt-cube-puzzle</artifactId>
    <version>${LATEST-VERSION}</version>
</dependency>
<dependency>
    <groupId>xyz.erupt</groupId>
    <artifactId>erupt-ai-canvas</artifactId>
    <version>${LATEST-VERSION}</version>
</dependency>
Make sure a default LLM is configured in the erupt-ai LLM menu; see Erupt AI Quick Start.
2. Pick a Cube
Open the AI Canvas menu, create a canvas, and add a binding under Data Models: set Data Type to cube and choose your semantic model as Data Model.
3. Say what you want
Open the Designer and describe the page as you would to a colleague:
Build a sales operations board: four KPI cards on top showing this month's revenue, order count, average order value and month-over-month change; a 12-month revenue trend line in the middle; a Top 10 revenue-by-region bar chart at the bottom, filterable by channel via a dropdown.
Seconds later the page is in front of you. Not quite right? Just say one more sentence.
Help the AI understand your data
Fill in description / prompt on @EruptCube, description on @Explore, and prompt on dimensions and measures while modeling. They become the business context the AI reads, and the results match your intent more closely.
Typical Scenarios
| Scenario | Example one-sentence request |
|---|---|
| Operations data wall | "A dark full-screen wall: KPIs ticking along the top, revenue trend in the middle, region and category rankings on both sides" |
| Executive cockpit | "A multi-metric board for management, with channel, region and time-range switches at the top" |
| Topic analysis page | "An inventory turnover page comparing days-on-hand per warehouse, highlighting anything over 60 days in red" |
| Summary + detail | "A pie chart of order share by channel on top; click a channel to list its orders below" |
| External embedding | "A clean white brand sales board I can embed in our website back office" |
Contributors
 YuePeng
 Claude Opus 5 (1M context)