
Report Configuration
Report configuration is the core entry point: define the query SQL, query dimensions, and table columns, then drill down to Chart Configuration and Modification History.
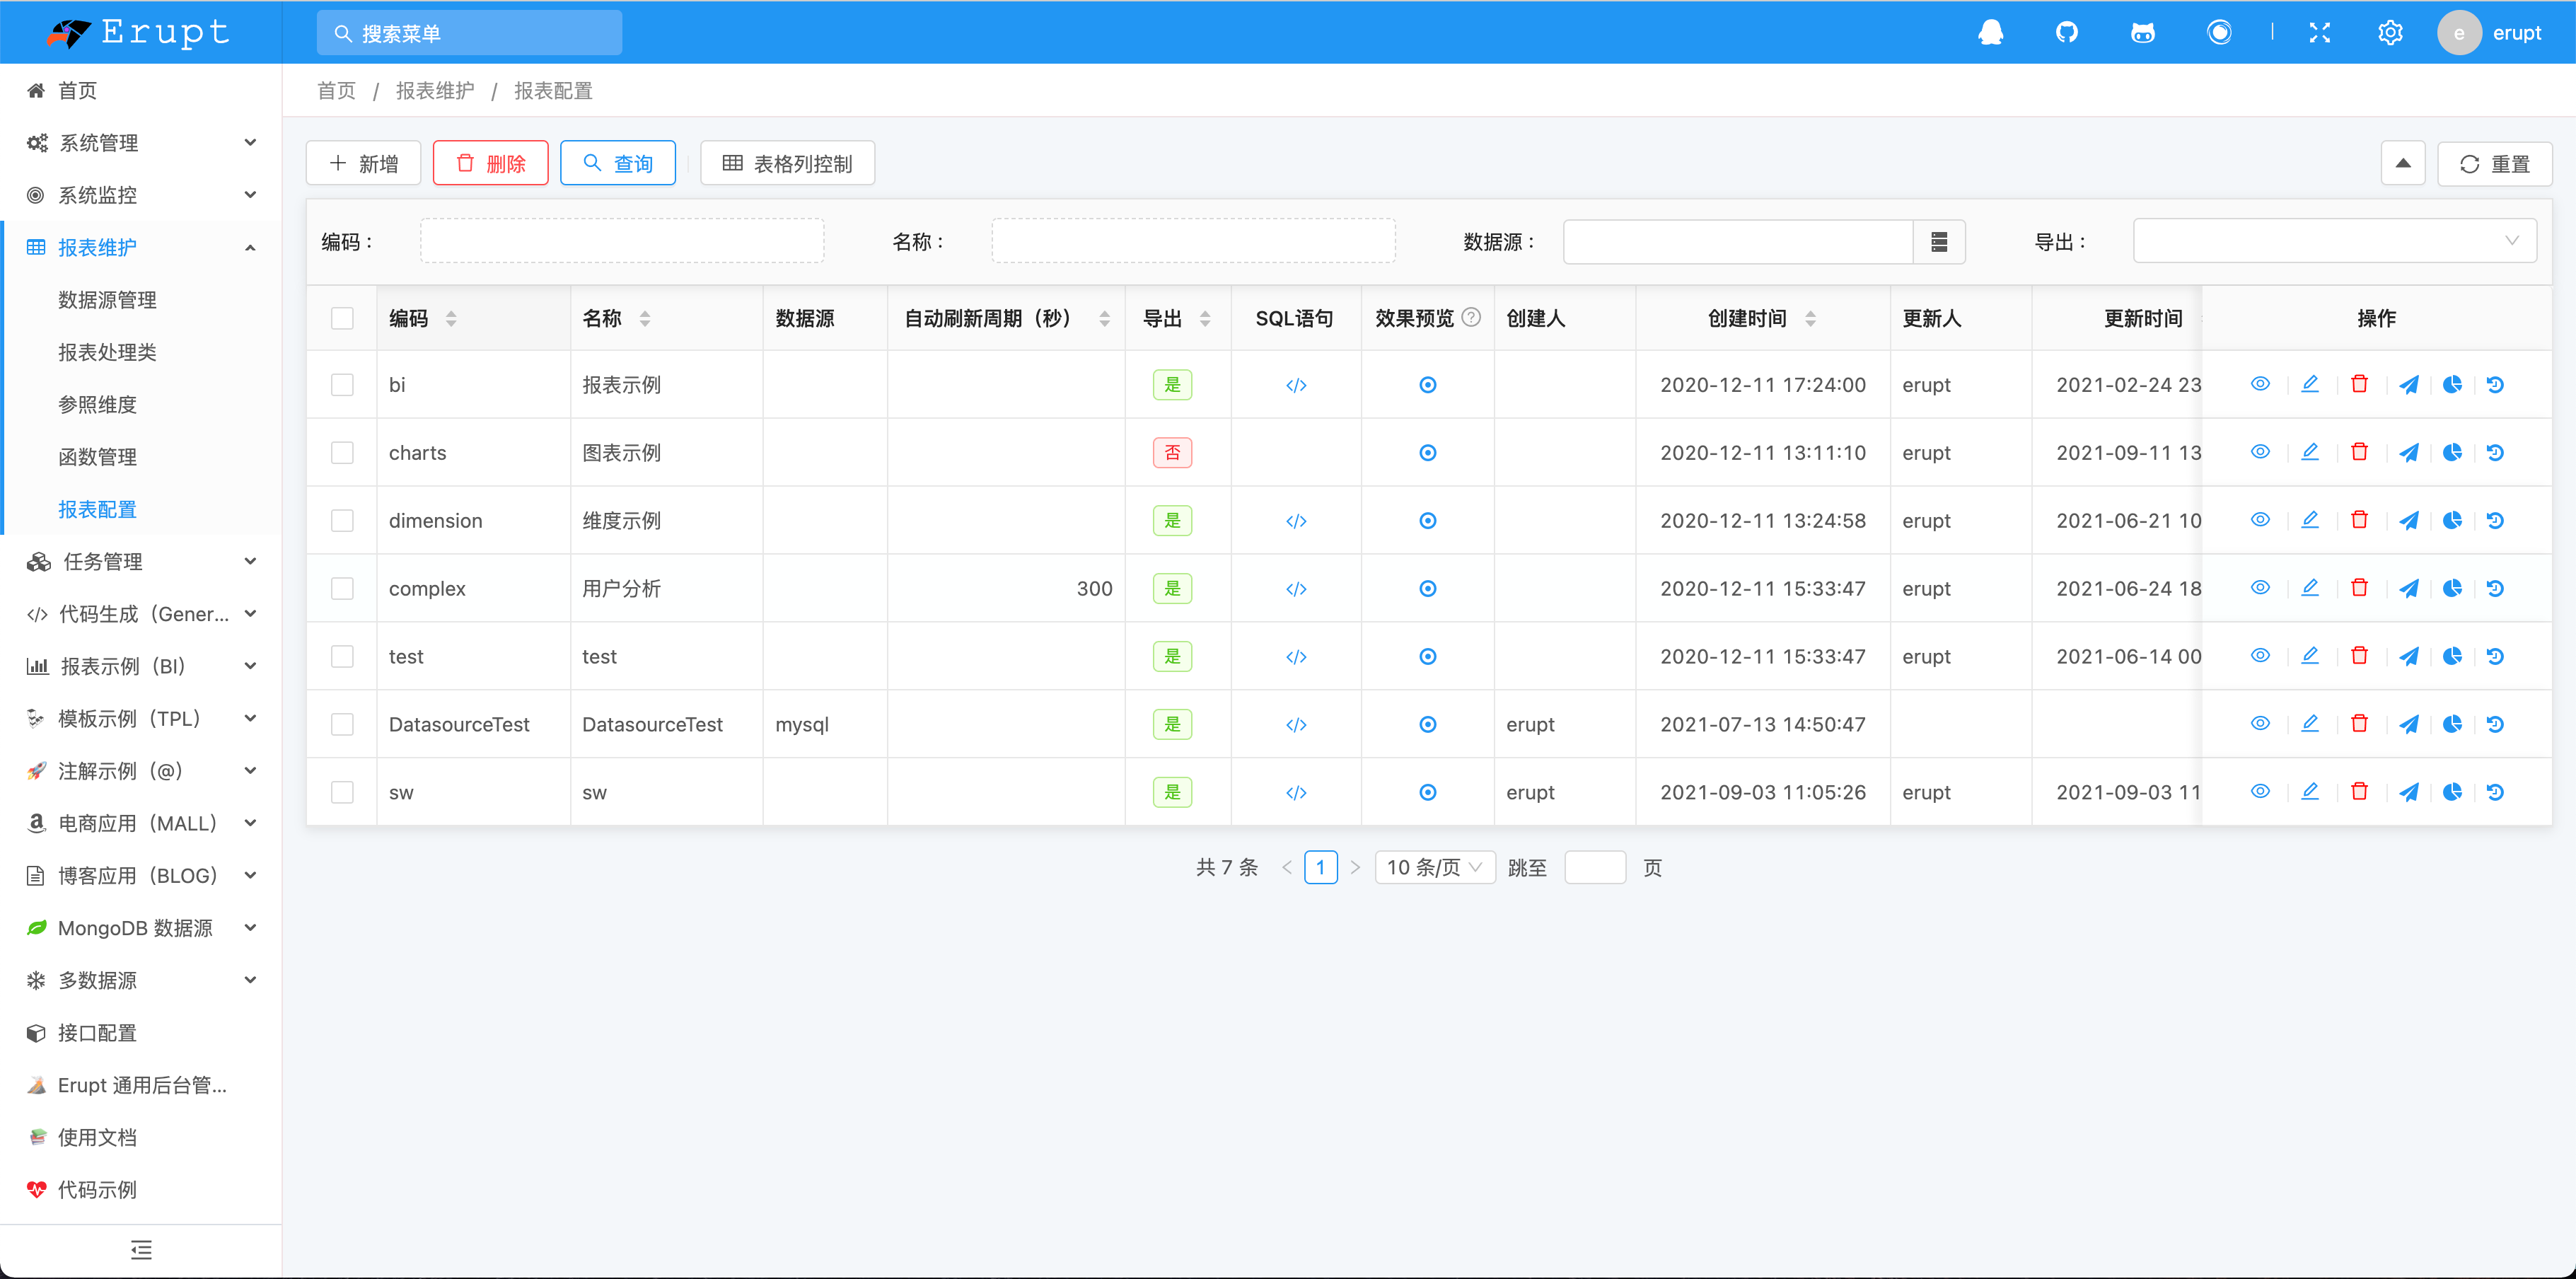
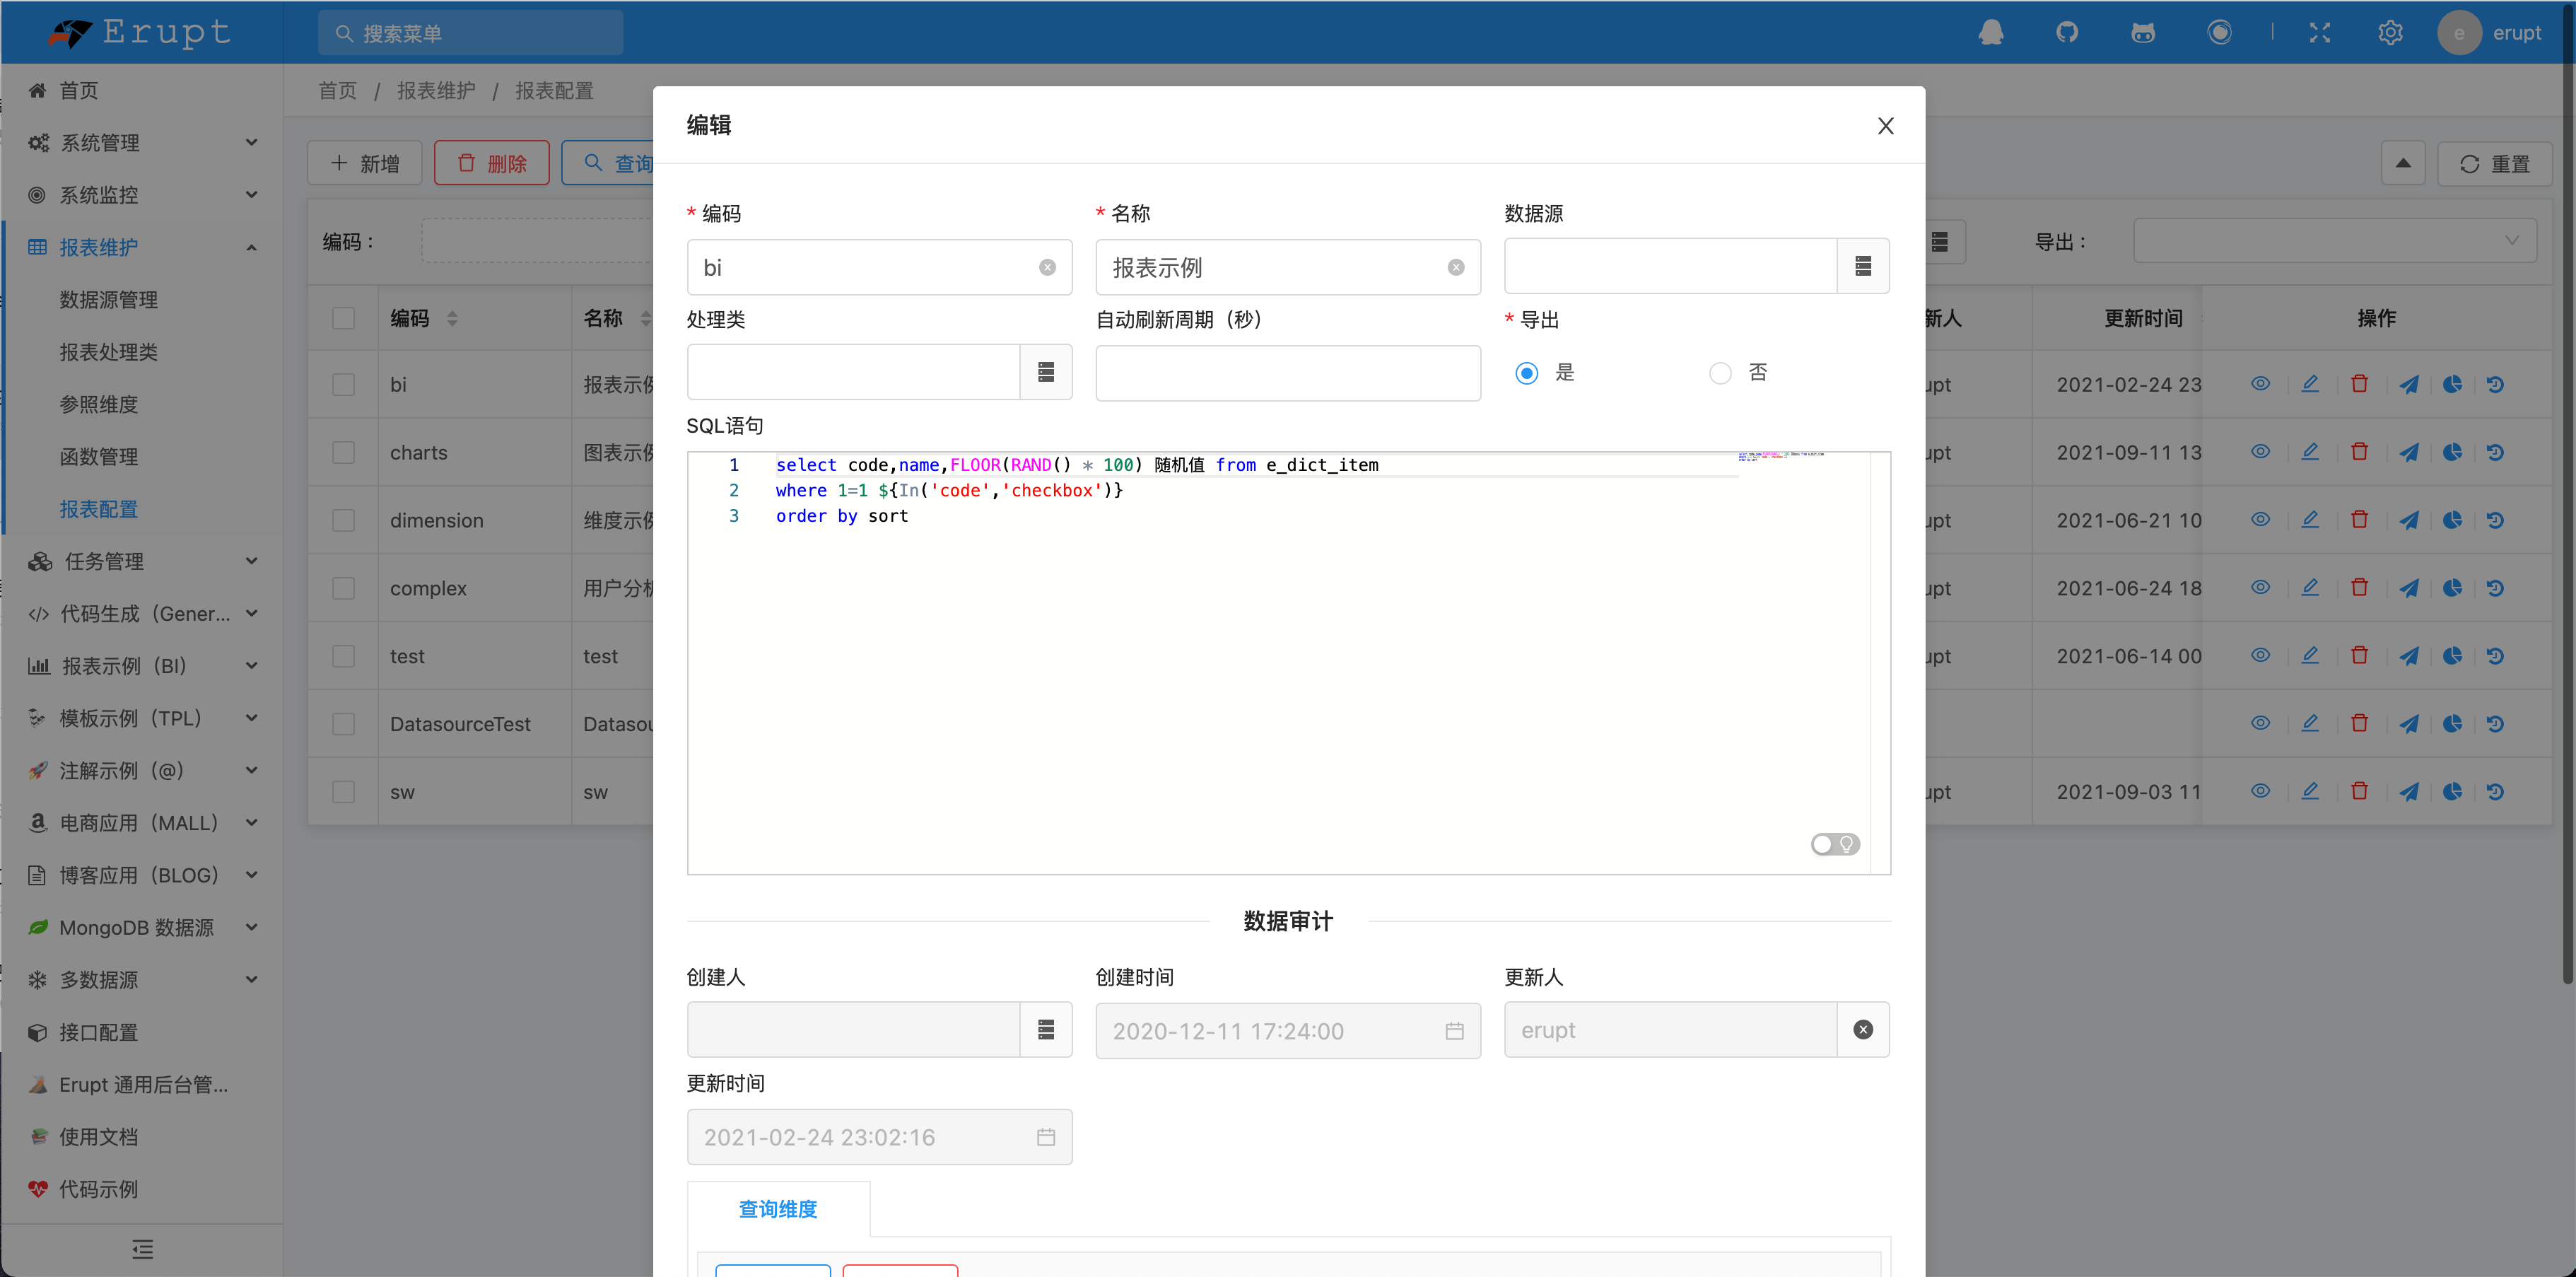
Configuration Options
| Option | Description |
|---|---|
| Code | Must be unique; used as the menu code when published; immutable after creation |
| Name | Report name |
| Group | Linked to Groups, organizing large numbers of reports as a tree |
| Data Source | Defaults to the Spring Boot default data source |
| Handler | Optionally bind a report handler |
| Pagination | Backend / frontend / none |
| Cache Duration (s) | Query result cache lifetime; 0 = no cache; default 1 second |
| Auto Refresh (s) | Interval for automatic data refresh on the page |
| Export | Whether the Excel export button is shown |
| Query SQL | The query statement for table data |
| Count SQL | Backend pagination only; computes the total row count. When omitted, a count(*) subquery is used — specify this when the nested count is slow |
| Preview | Preview in a dialog once configured (requires the menu to be published and authorized first) |
Report SQL
Read a reference dimension value with ${dimension_code}.
Use custom functions to process reference dimensions dynamically:
# The first argument of the and function is the database field name,
# the second is the query dimension code
select * from xxx where 1=1 ${and('field','dimension')}
# Compiled result →
select * from xxx where 1=1 and field = 'xxx'
SQL Context Variables
The following objects are available anywhere SQL is configured, via ${context_variable}:
| Variable | Description |
|---|---|
__request__ | Request object (HttpServletRequest) |
__response__ | Response object (HttpServletResponse) |
__uid__ | Current user ID — the id column of the e_upms_user table |
__pageIndex__ | Page index |
__pageSize__ | Page size |
__export__ | true when exporting, false when querying (boolean) |
Usage
# Query data of the current user
select * from xxx where id = ${__uid__}
# Compiled result →
select * from xxx where id = 1
# Execution result
[{"account":"erupt","name":"Administrator","id":1}]
Query Dimensions
The type of a report's search fields — 20+ query components are supported:
| Category | Dimension Types |
|---|---|
| Text | Text, Tag |
| Number | Number, Number Range |
| Date & Time | Date, Time, DateTime, Week, Month, Year, Date Range, DateTime Range |
| List References | Single Reference, Multi Reference, Radio Reference, Checkbox Reference |
| Tree References | Single Tree Reference, Multi Tree Reference, Cascade Reference |
| Table References | Single Table Reference, Multi Table Reference |
Reference types must be linked to a reference dimension. Default values are generated dynamically via JS expressions; quote string literals.
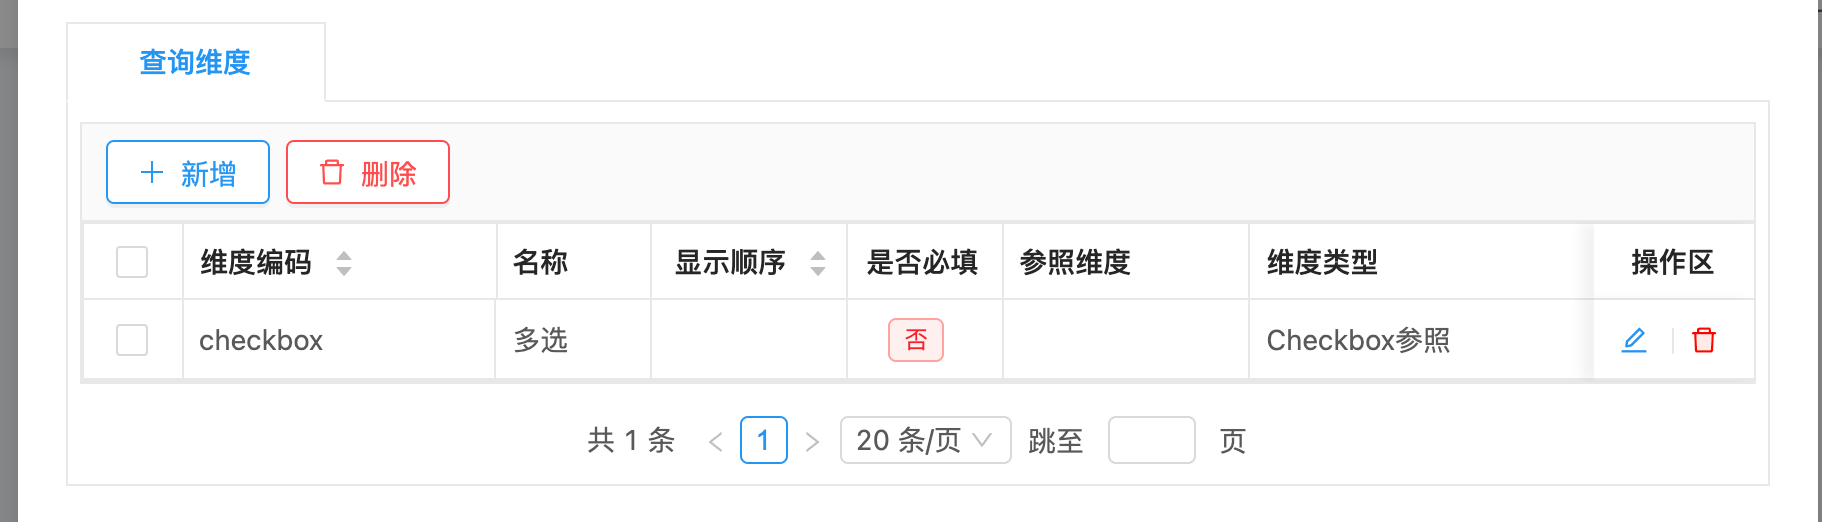
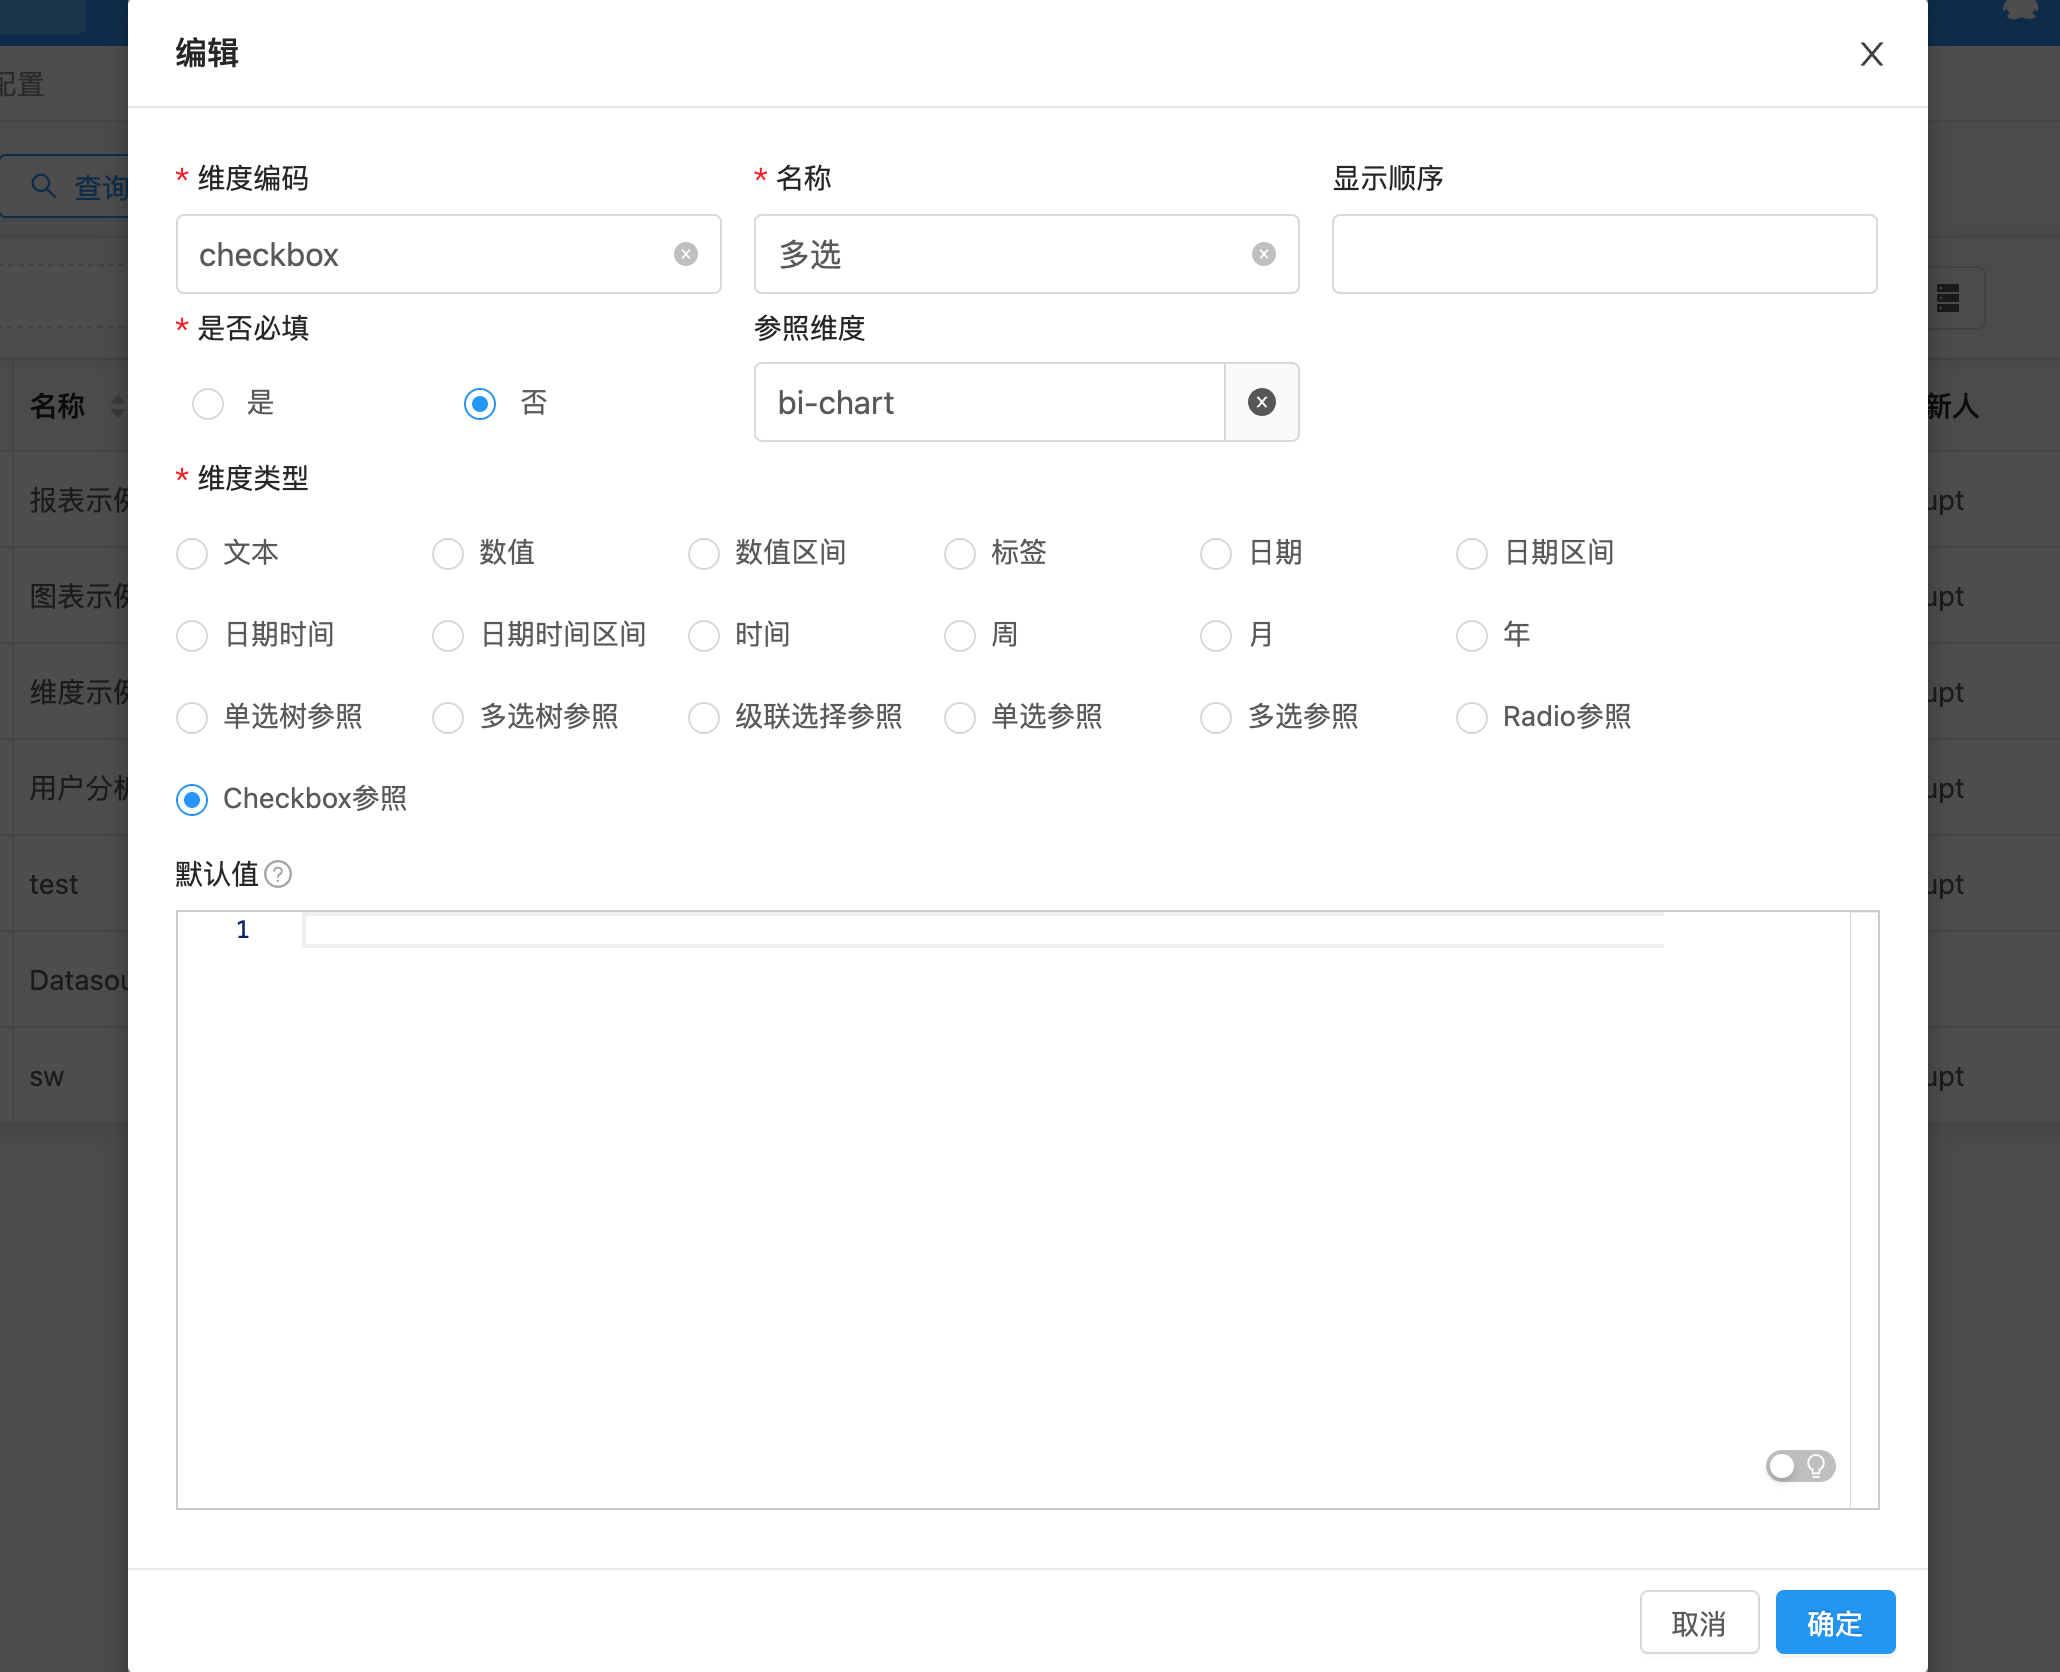
Table Column Configuration
WARNING
Table columns are displayed dynamically — columns without mapped configuration need no setup!
| Column Type | Description |
|---|---|
| Text | Default type |
| Number | Right-aligned |
| Time | Center-aligned |
| Long Text | Auto-collapsed when content is long |
| Percent | Displayed as a progress bar |
| Link | Opens on click |
| Link (Dialog) | Opens in a dialog |
| Drill Down | Runs the drill SQL on click and shows details in a dialog |
Each column can also configure width, display, and sortable.
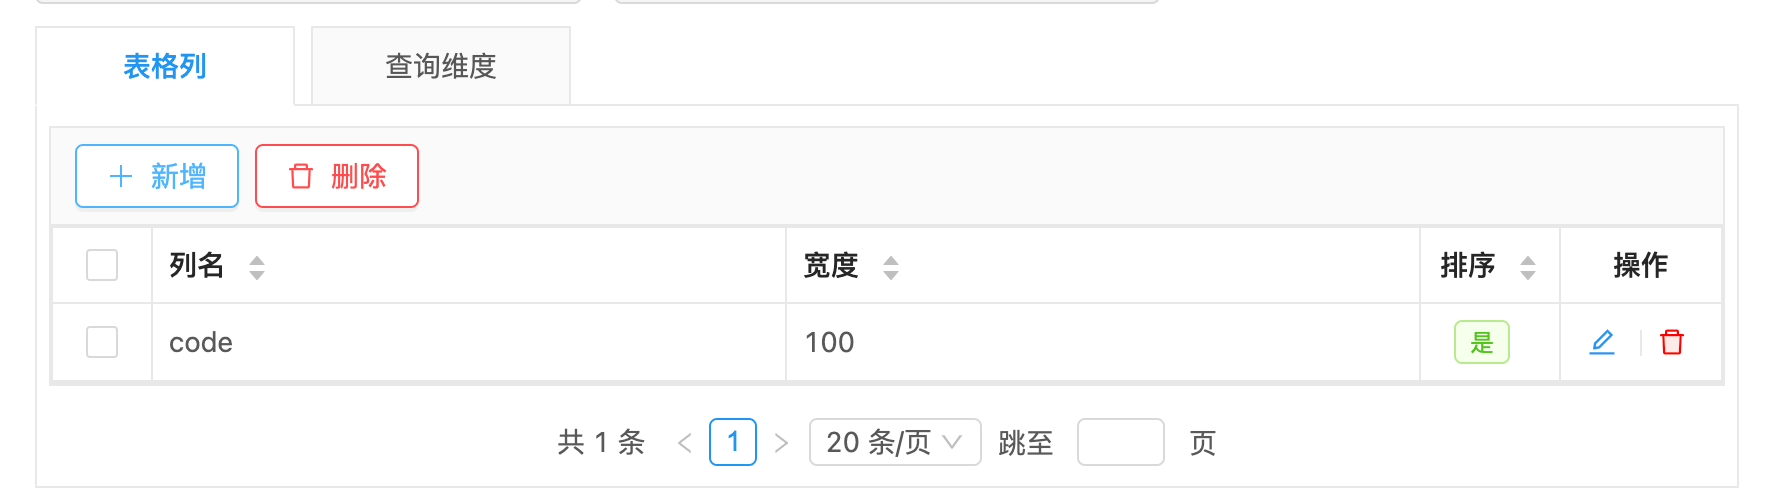
Column Drill-down
Select the Drill Down type in the table column configuration, and a drill-down SQL input appears (required for this type).
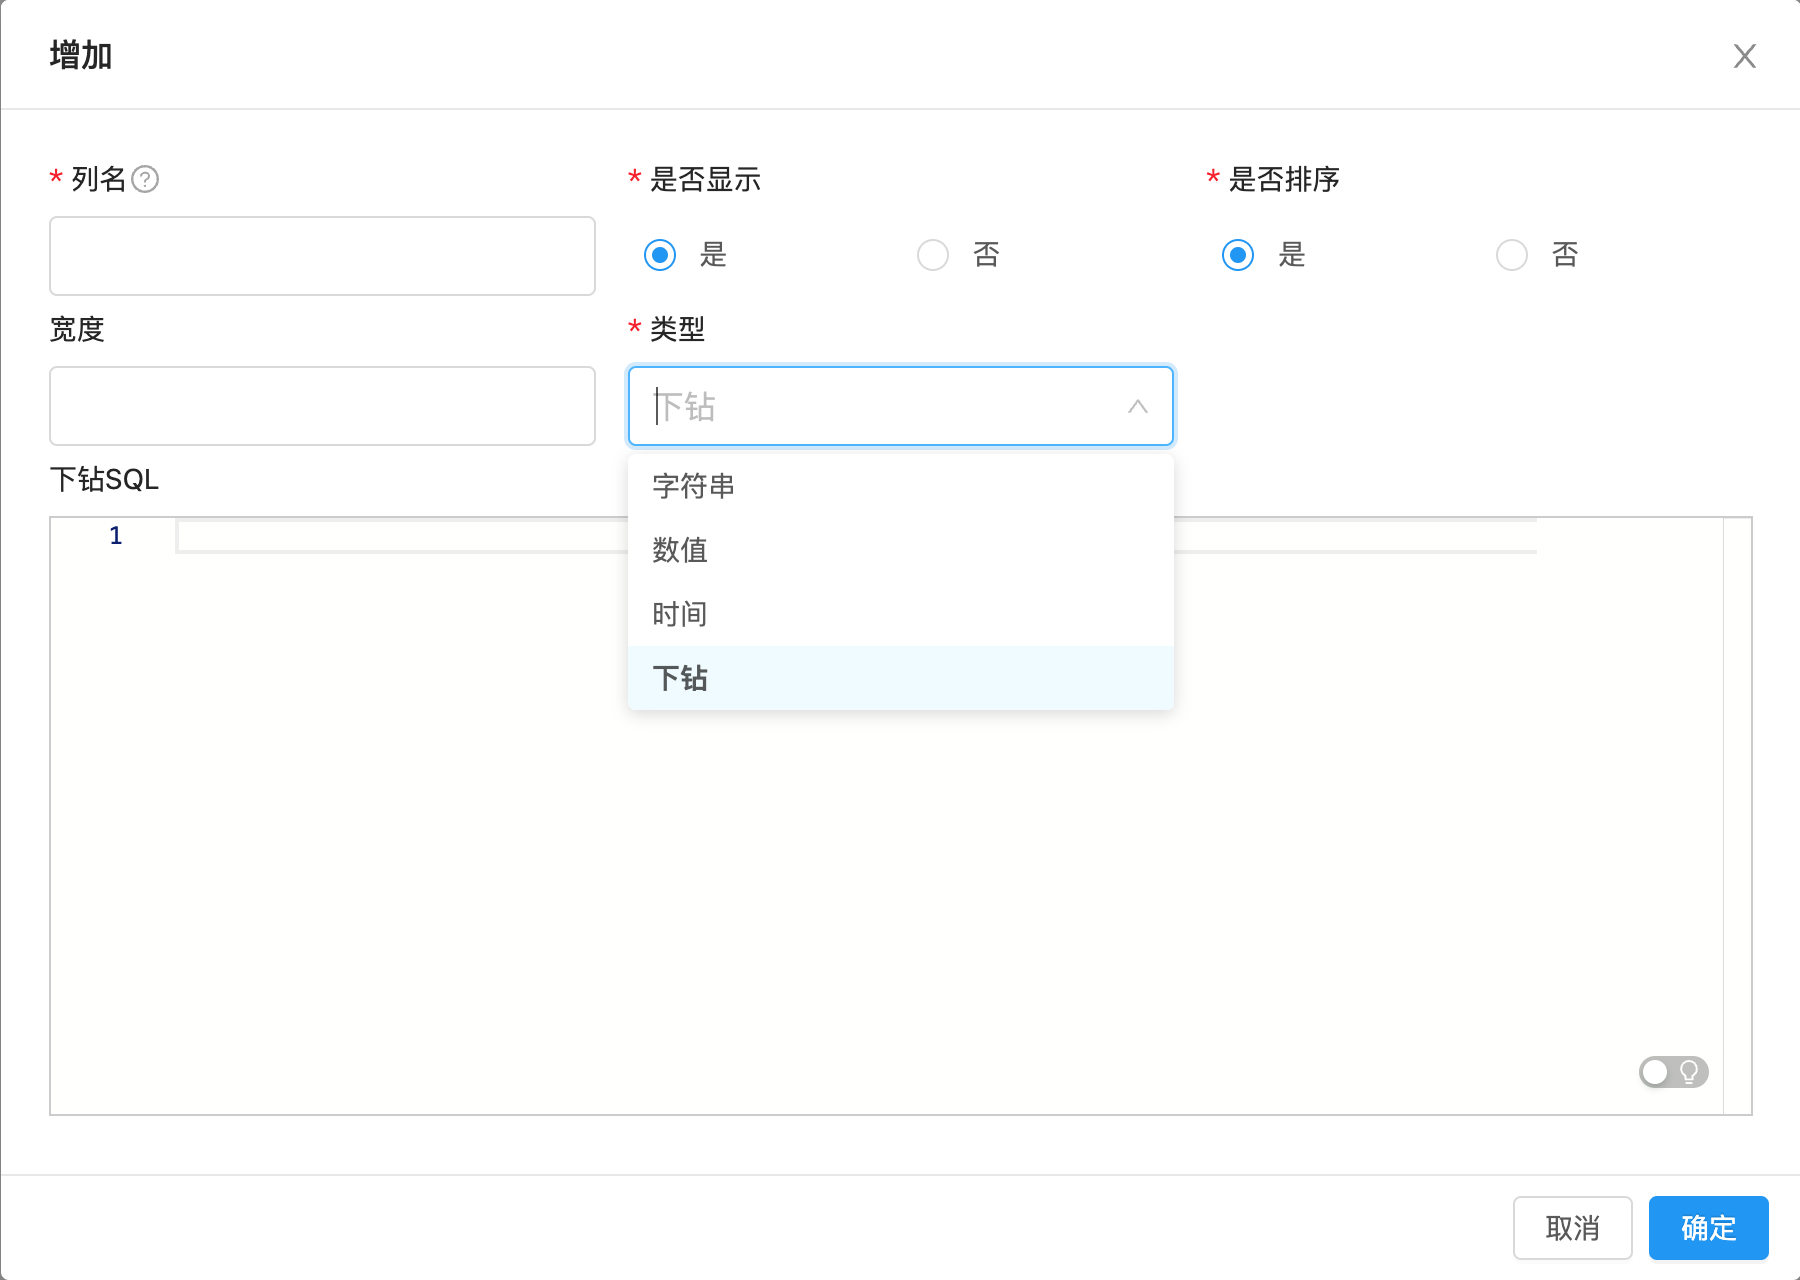
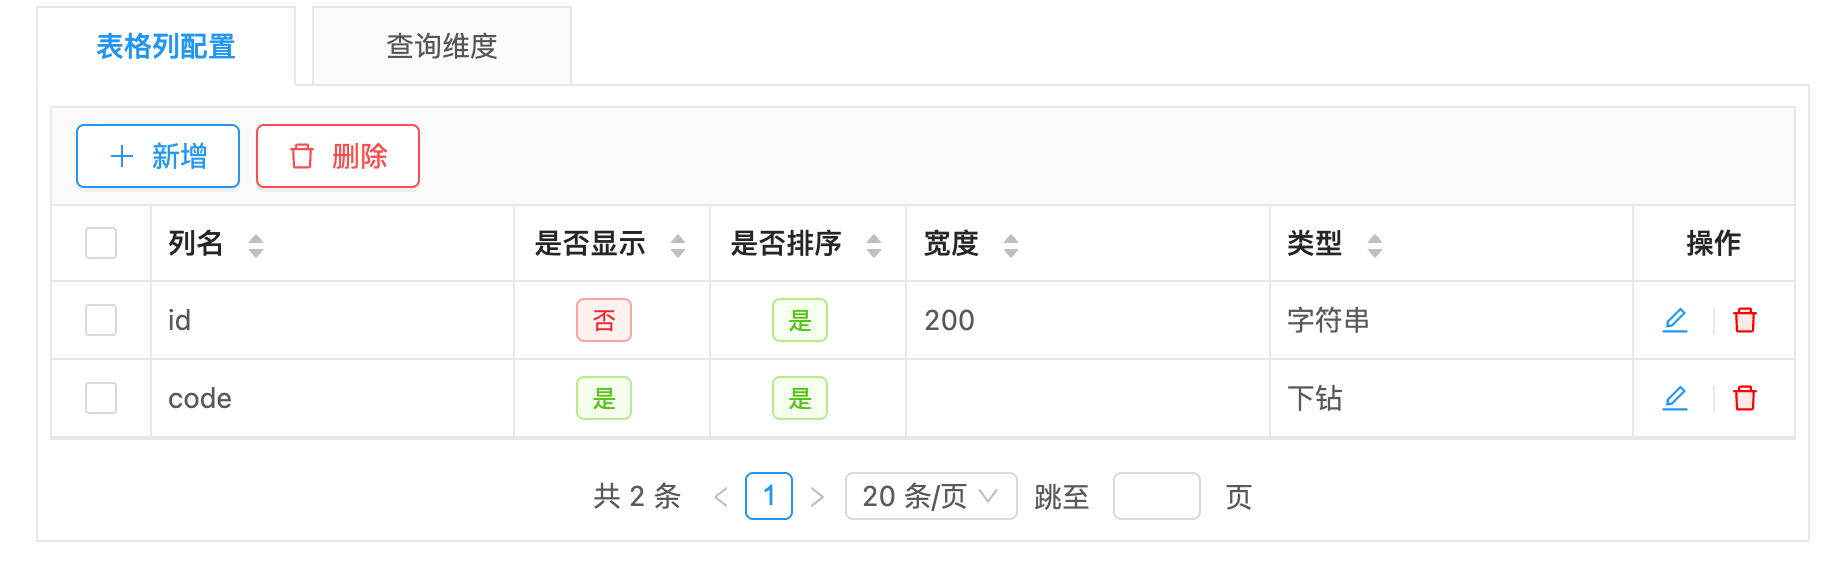
Configuration rules:
Write any SQL you like; reference row values with a colon followed by the column name. If you don't want the drill column shown on the page, hide the id column as in the screenshot above.
select * from e_upms_menu where id = :idResult
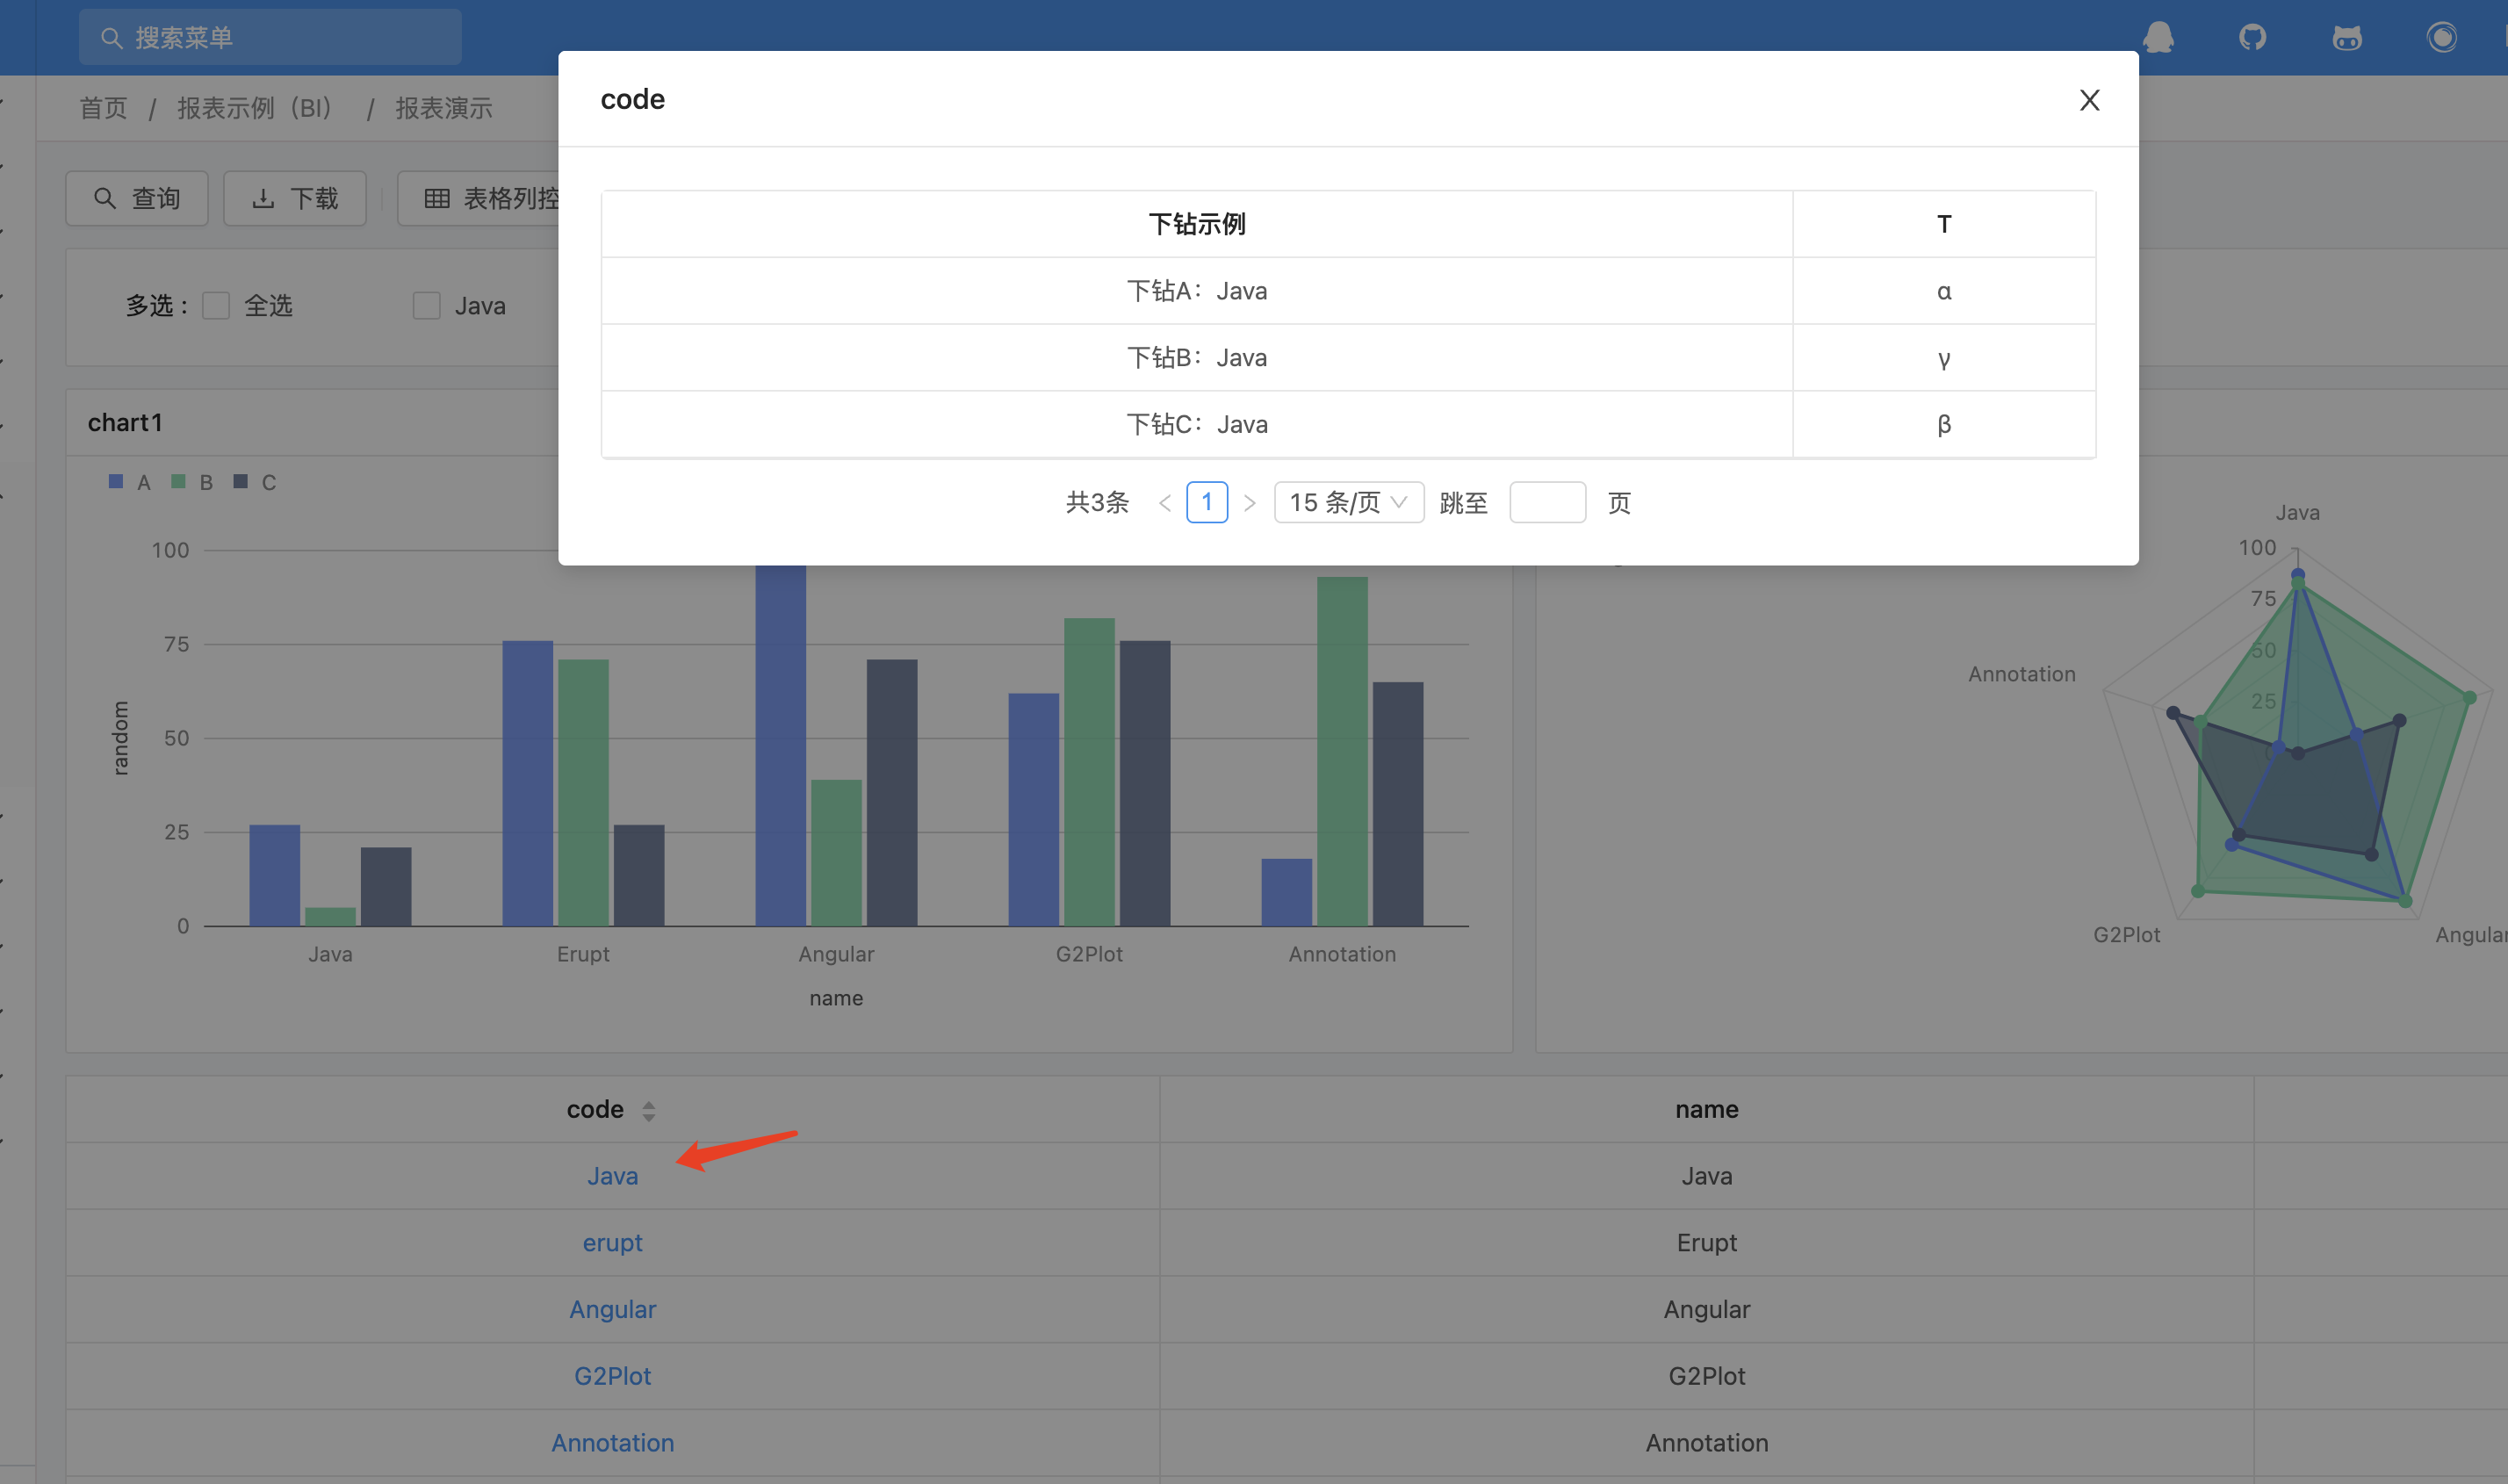
Chart Configuration
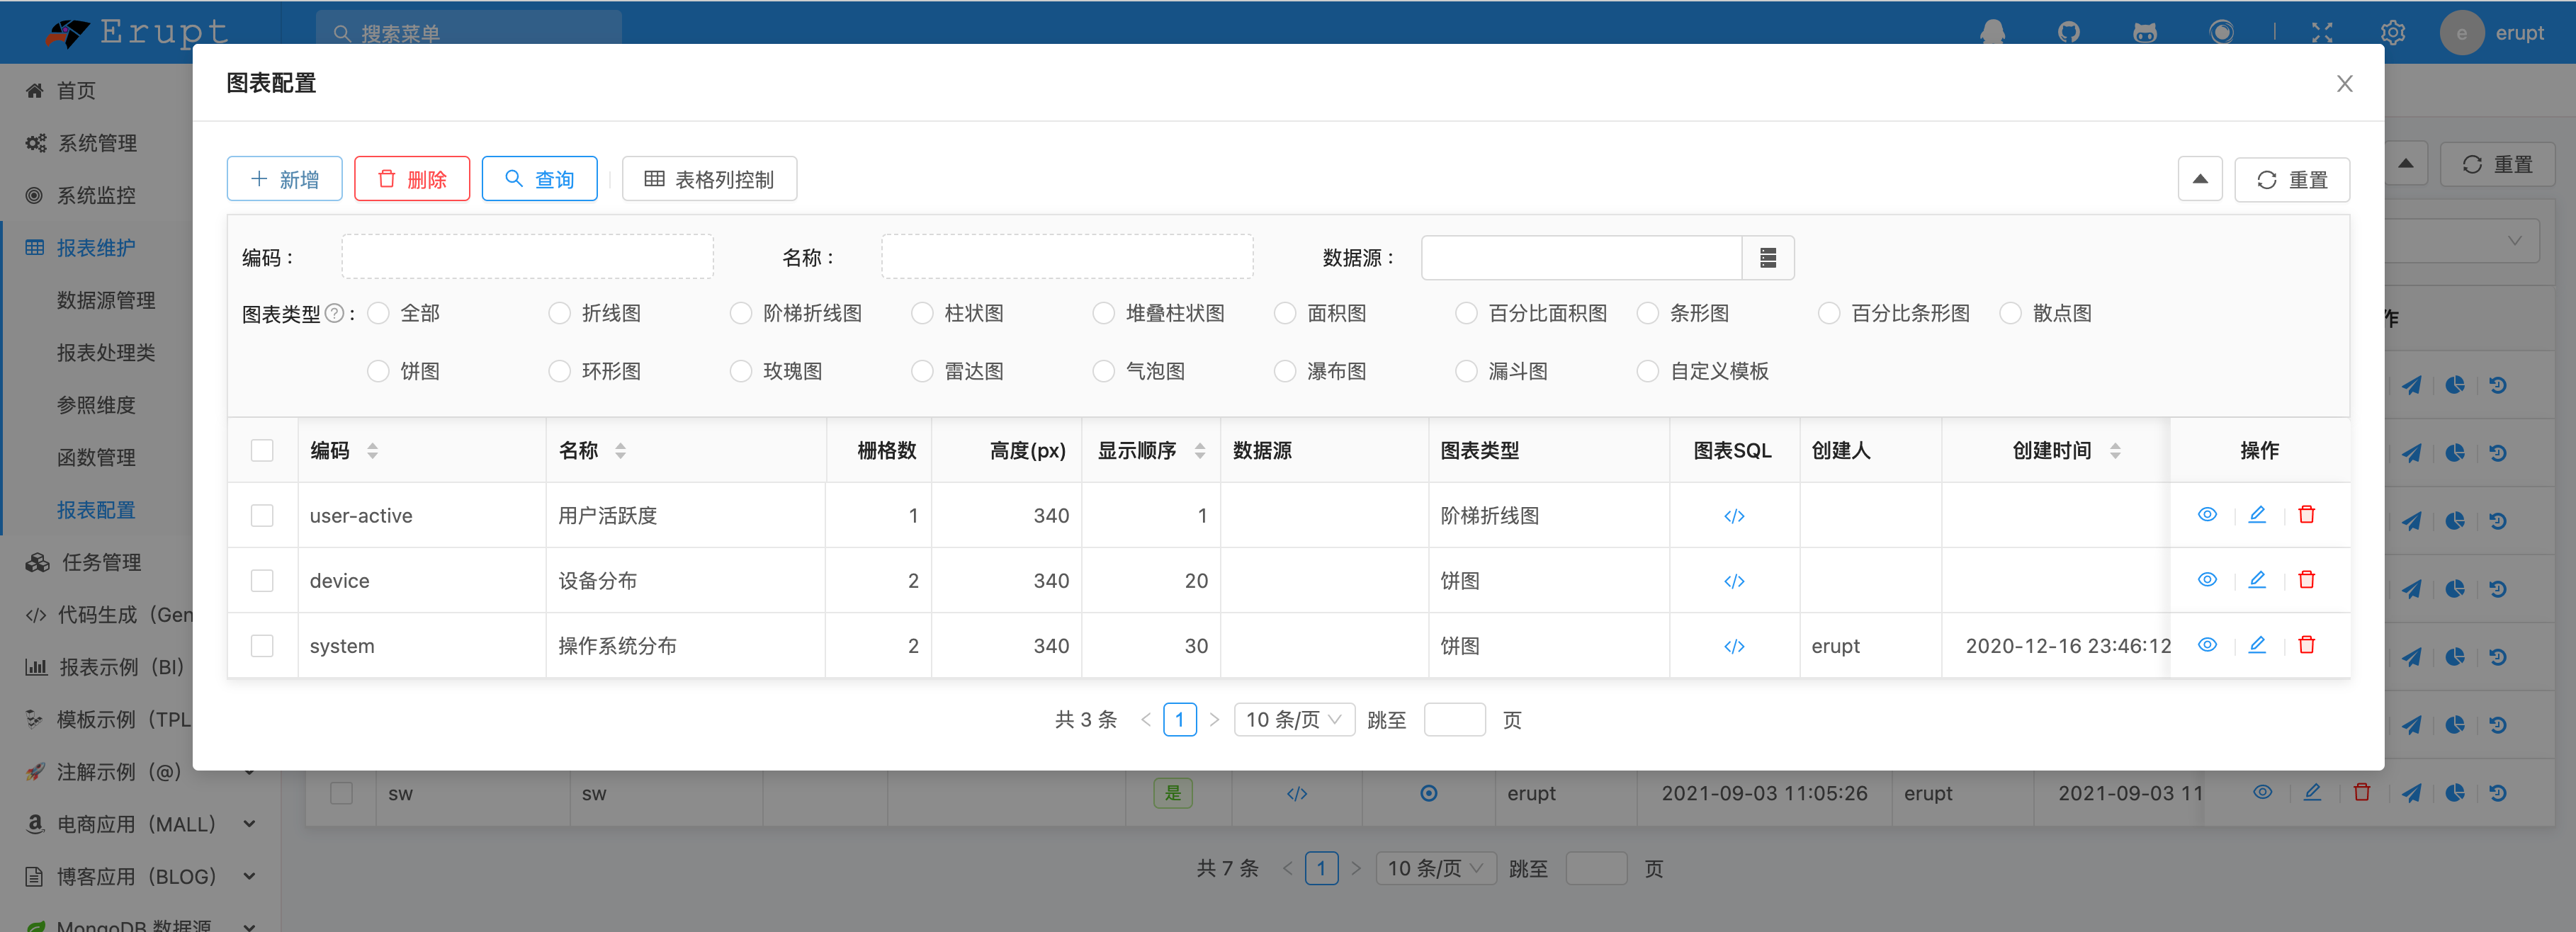
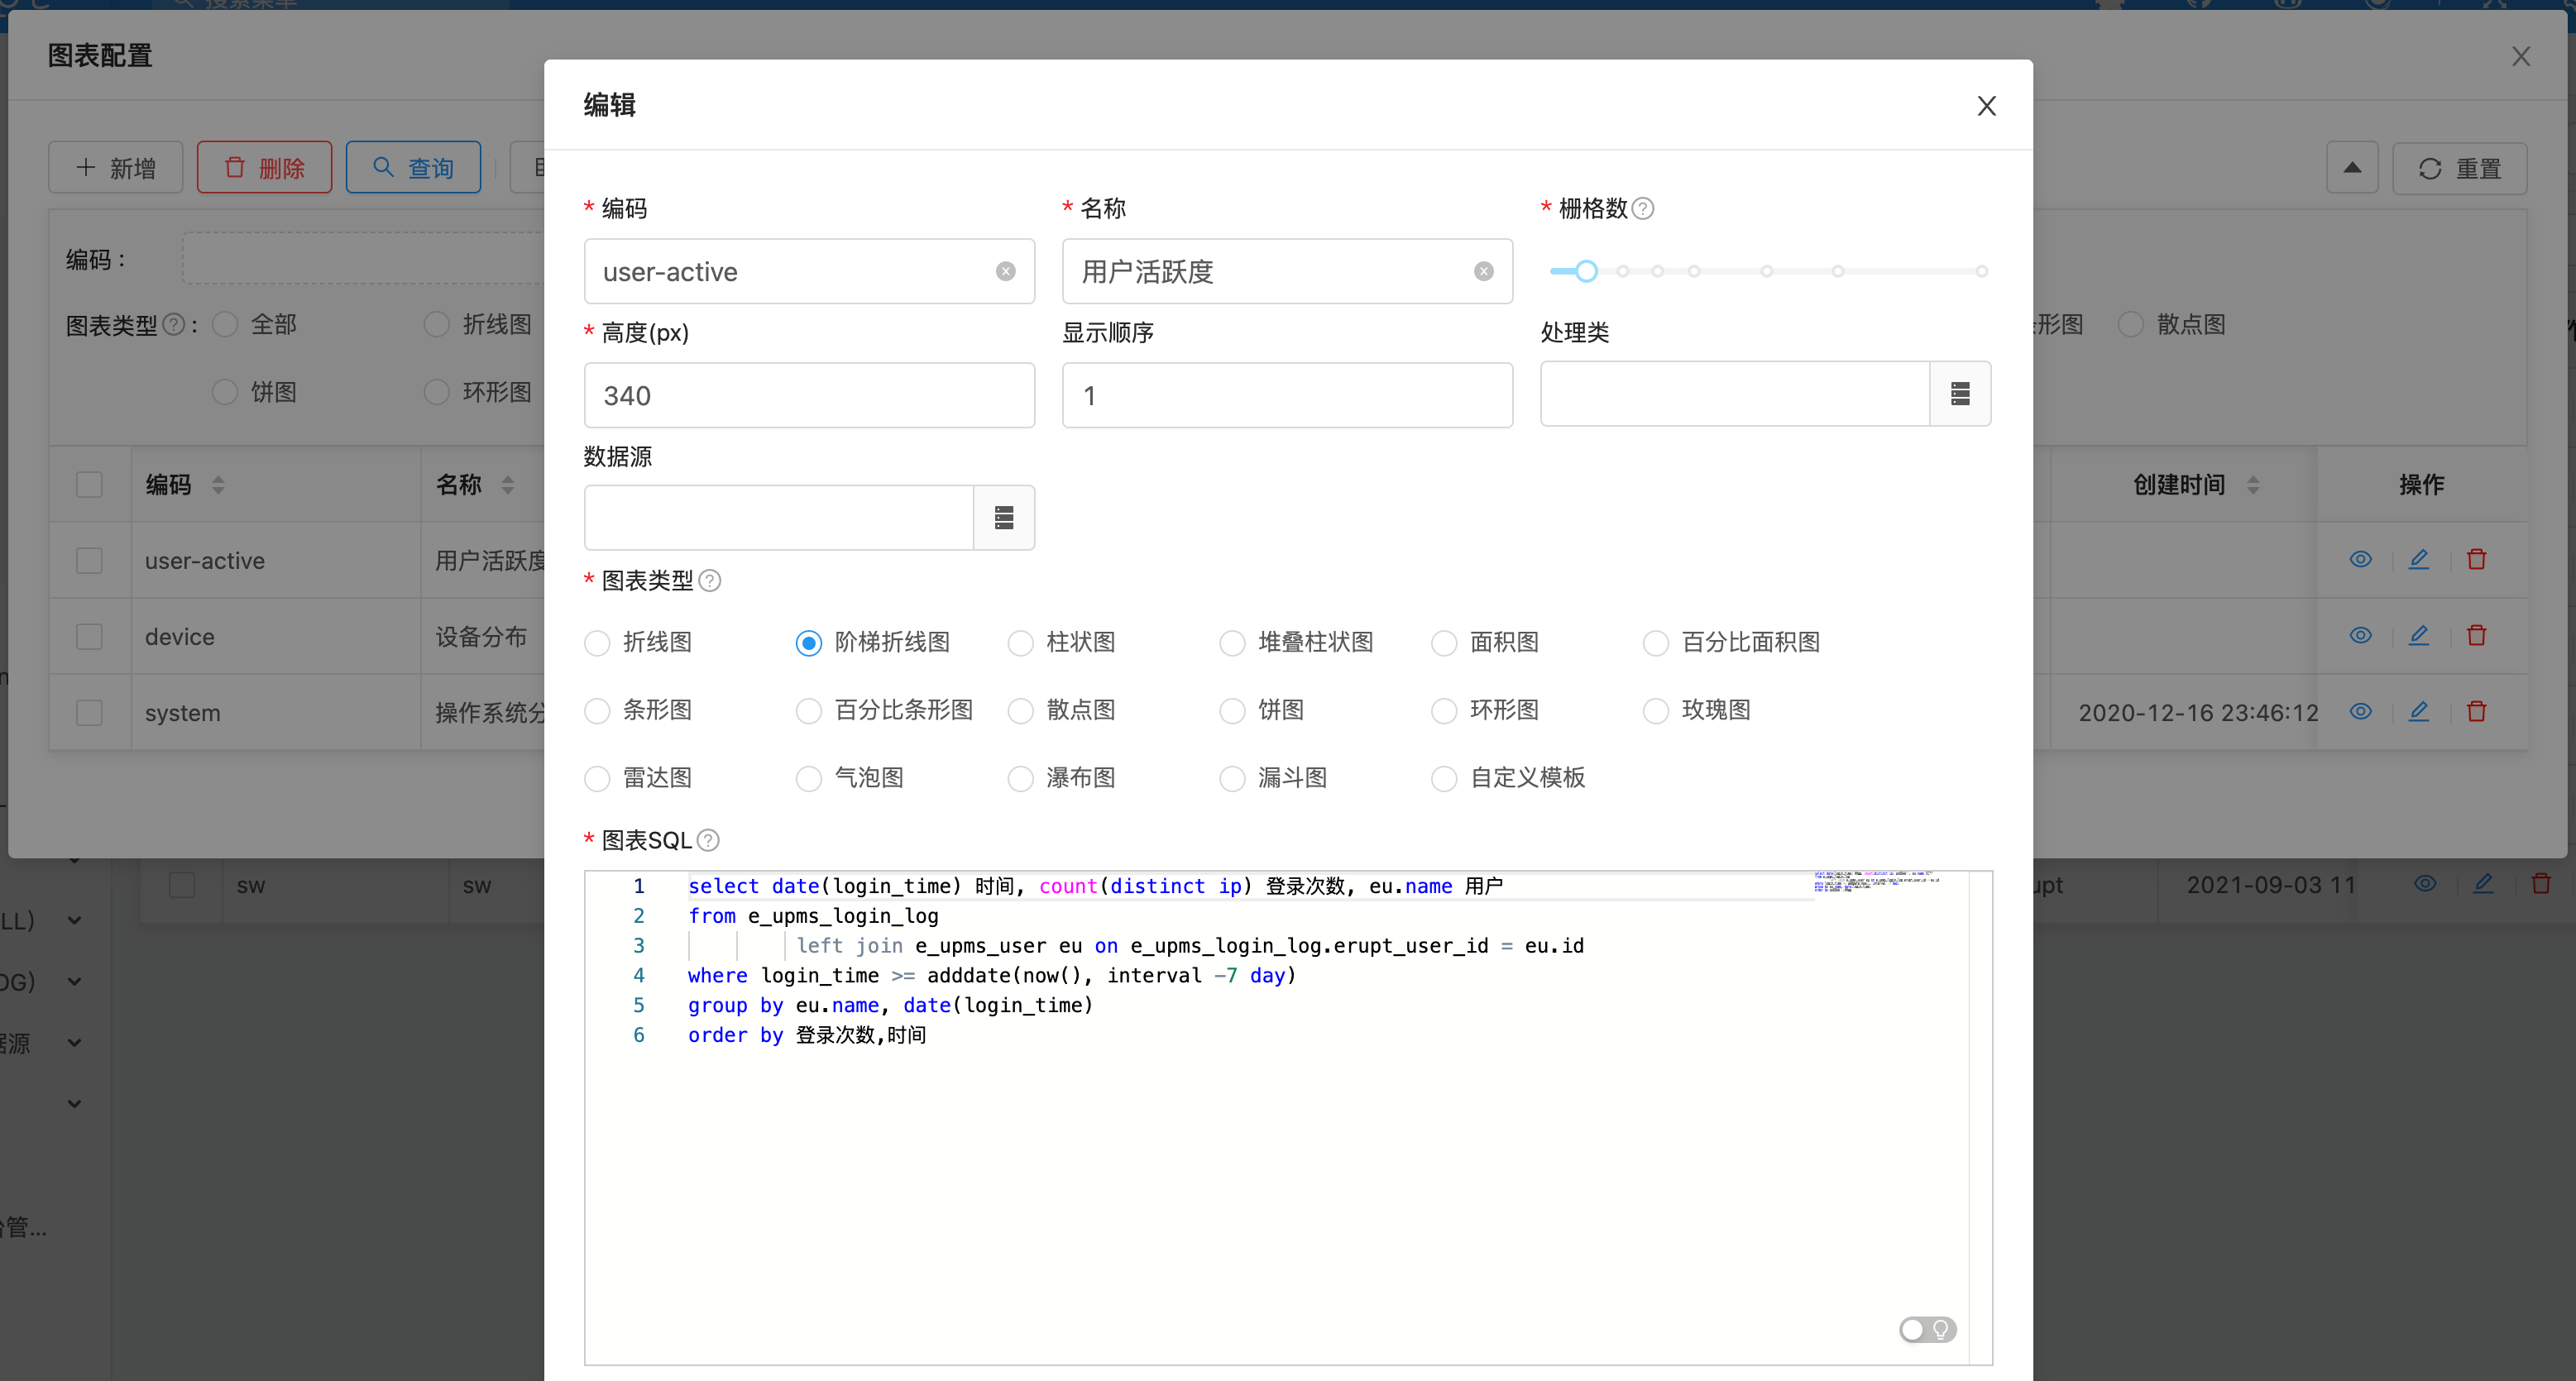
Maintained in the Chart Config drill of each report row. A report can host multiple charts; build them quickly with SQL, with chart-dimension linkage supported.
| Option | Description |
|---|---|
| Code | Unique within the report; immutable after creation |
| Name | Chart name |
| Grid | Grid units the chart occupies; 24 = full row; default 24 |
| Height (px) | Chart height; default 340 |
| Data Source / Handler | Same as report configuration; each chart can specify its own |
| Cache Duration (s) | Chart data cache lifetime; default 1 second |
| Chart Type | See the table below; rendered by G2Plot |
| Chart SQL | The chart data query |
| Custom Chart Config | JSON, following G2Plot options, for deep chart customization |
Supported chart types and their SQL column conventions:
| Chart Type | SQL Columns |
|---|---|
| Statistic | 1–2 columns: value / [name] |
| Alert | 1 column; multiple rows auto-concatenated, highlights key information |
| Line, Step Line, Bar, Stacked Bar, Area, Percentage Area, Horizontal Bar, Percentage Stacked Bar, Radar, Scatter, Radial Bar | 2–3 columns: name / value / [category] |
| Bubble | 4 columns: x / y / series / size |
| Pie, Ring, Rose, Funnel | 2 columns: name / value |
| Waterfall | 2 columns: name / incremental value |
| Word Cloud | 2–3 columns: name / value / [category] |
| Sankey, Chord | 3 columns: name / value / target name |
| Table | Any number of columns |
| Component Template | Rendered by the bound component template |
Groups
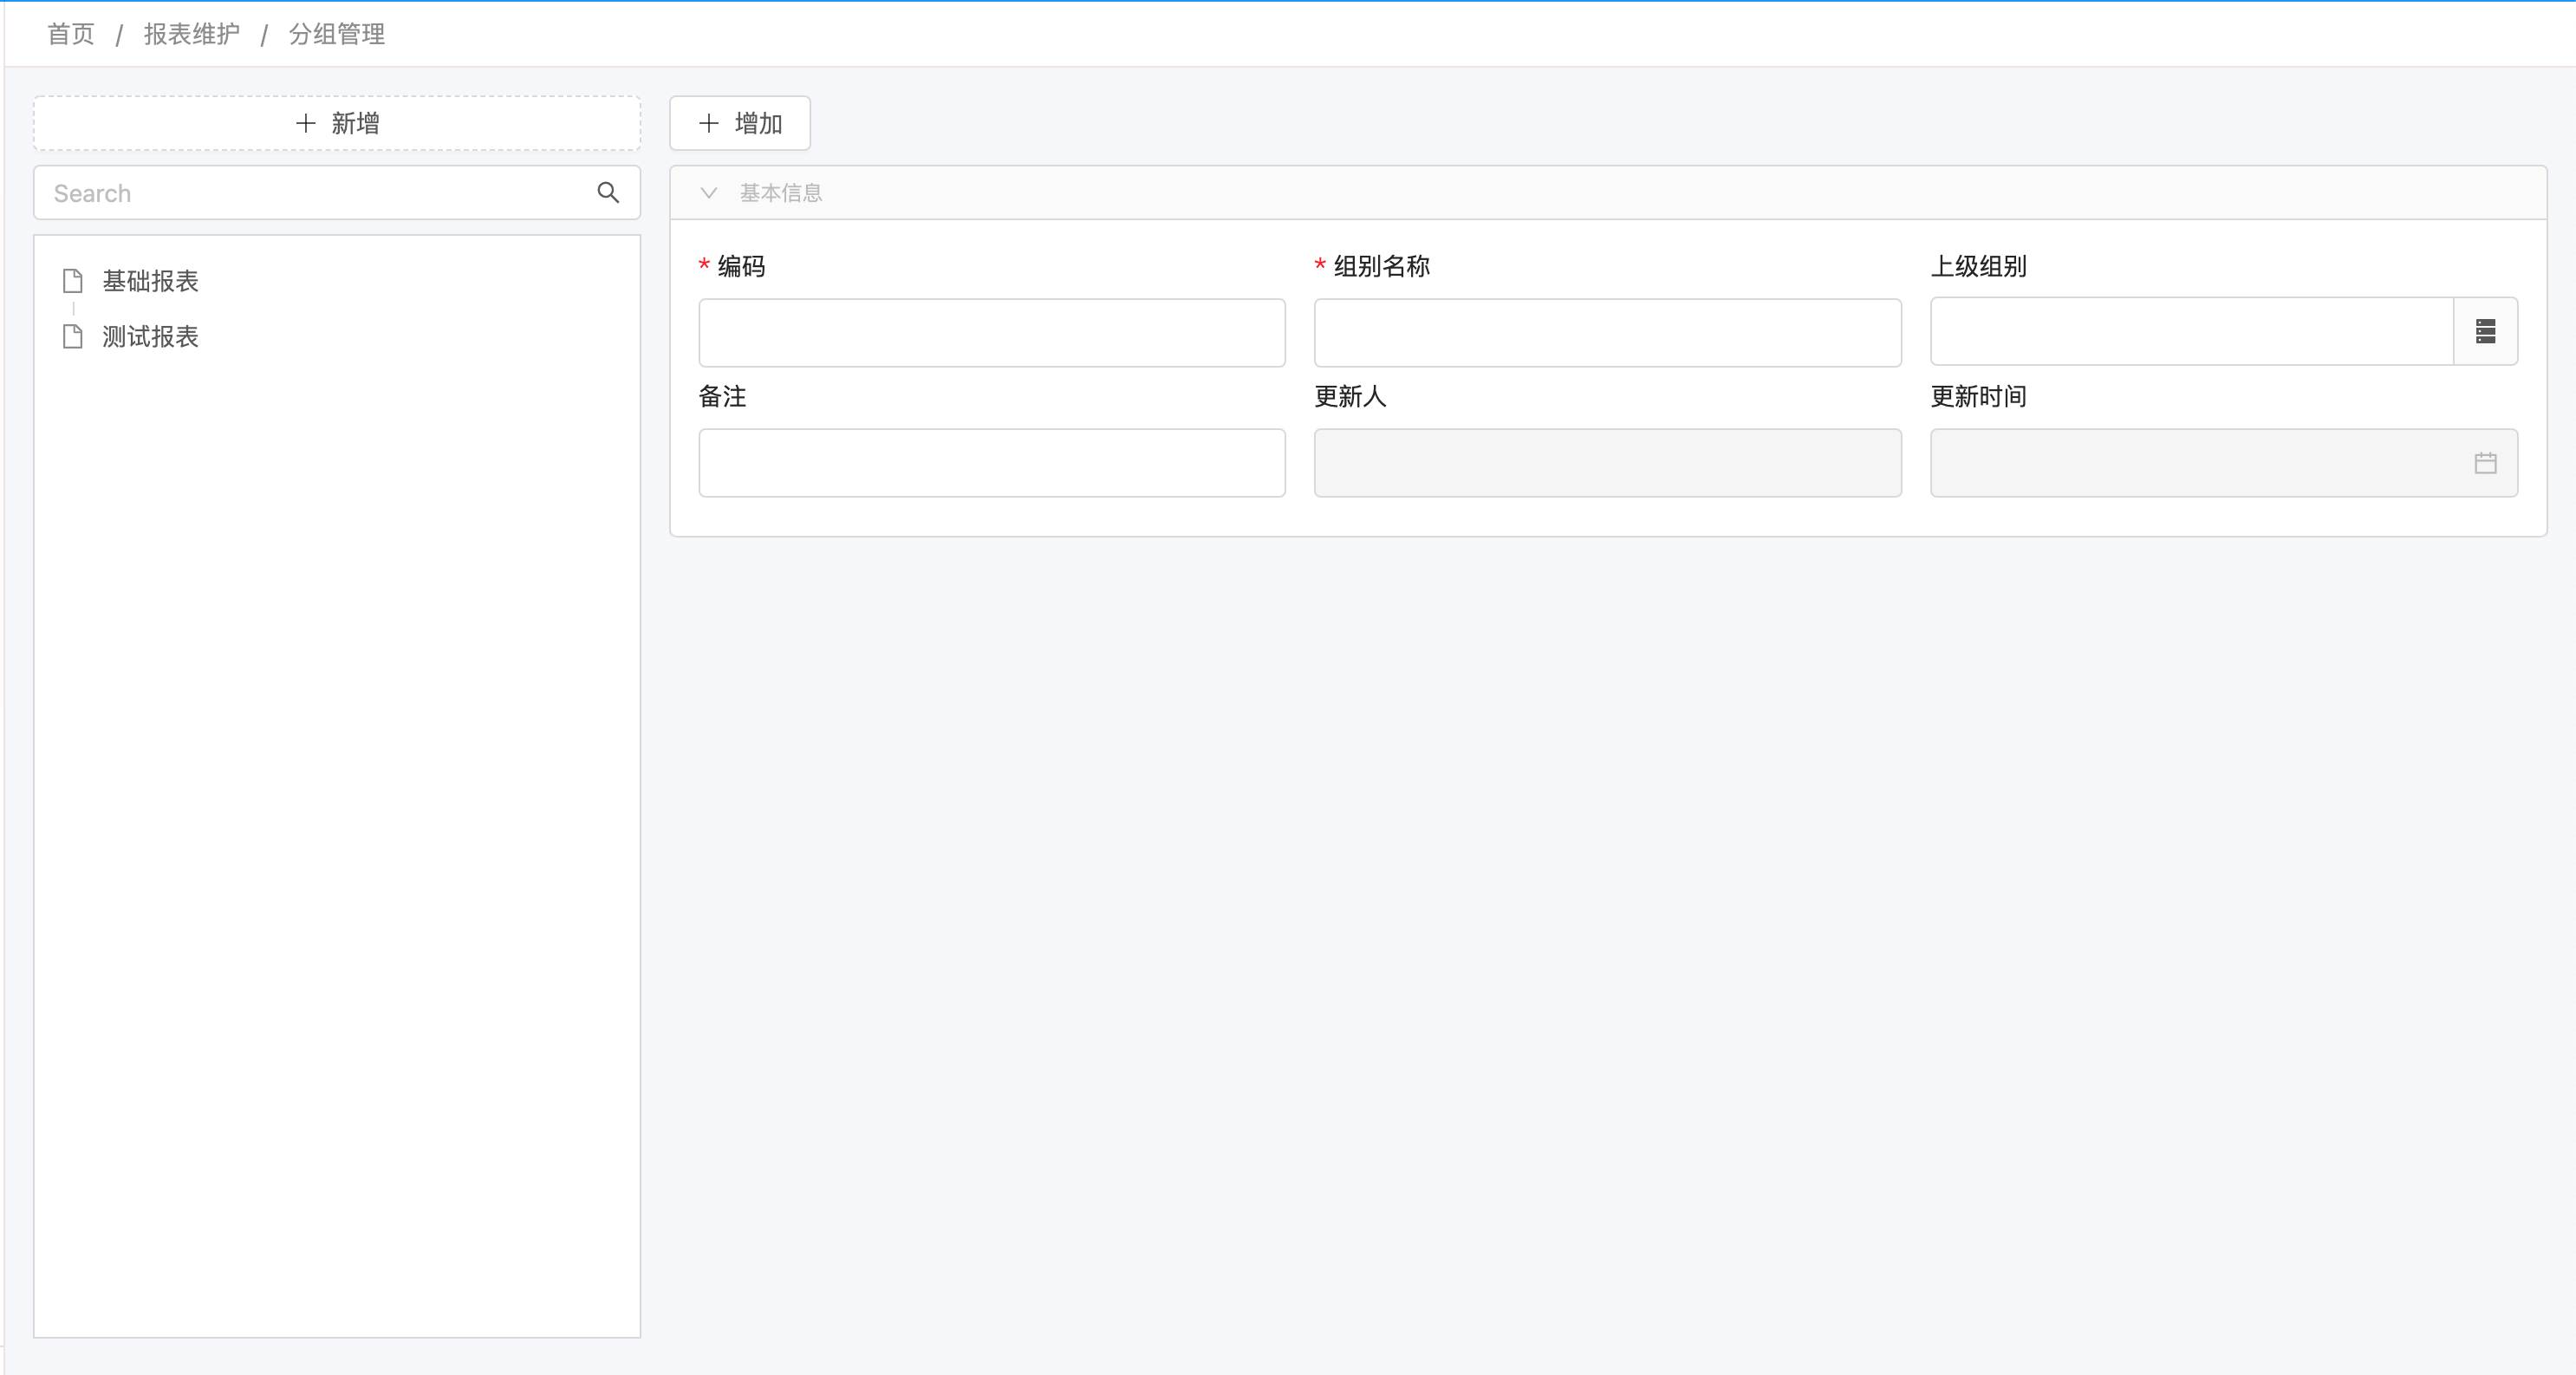
Configure tree-shaped groups to keep large numbers of reports organized.
Component Templates
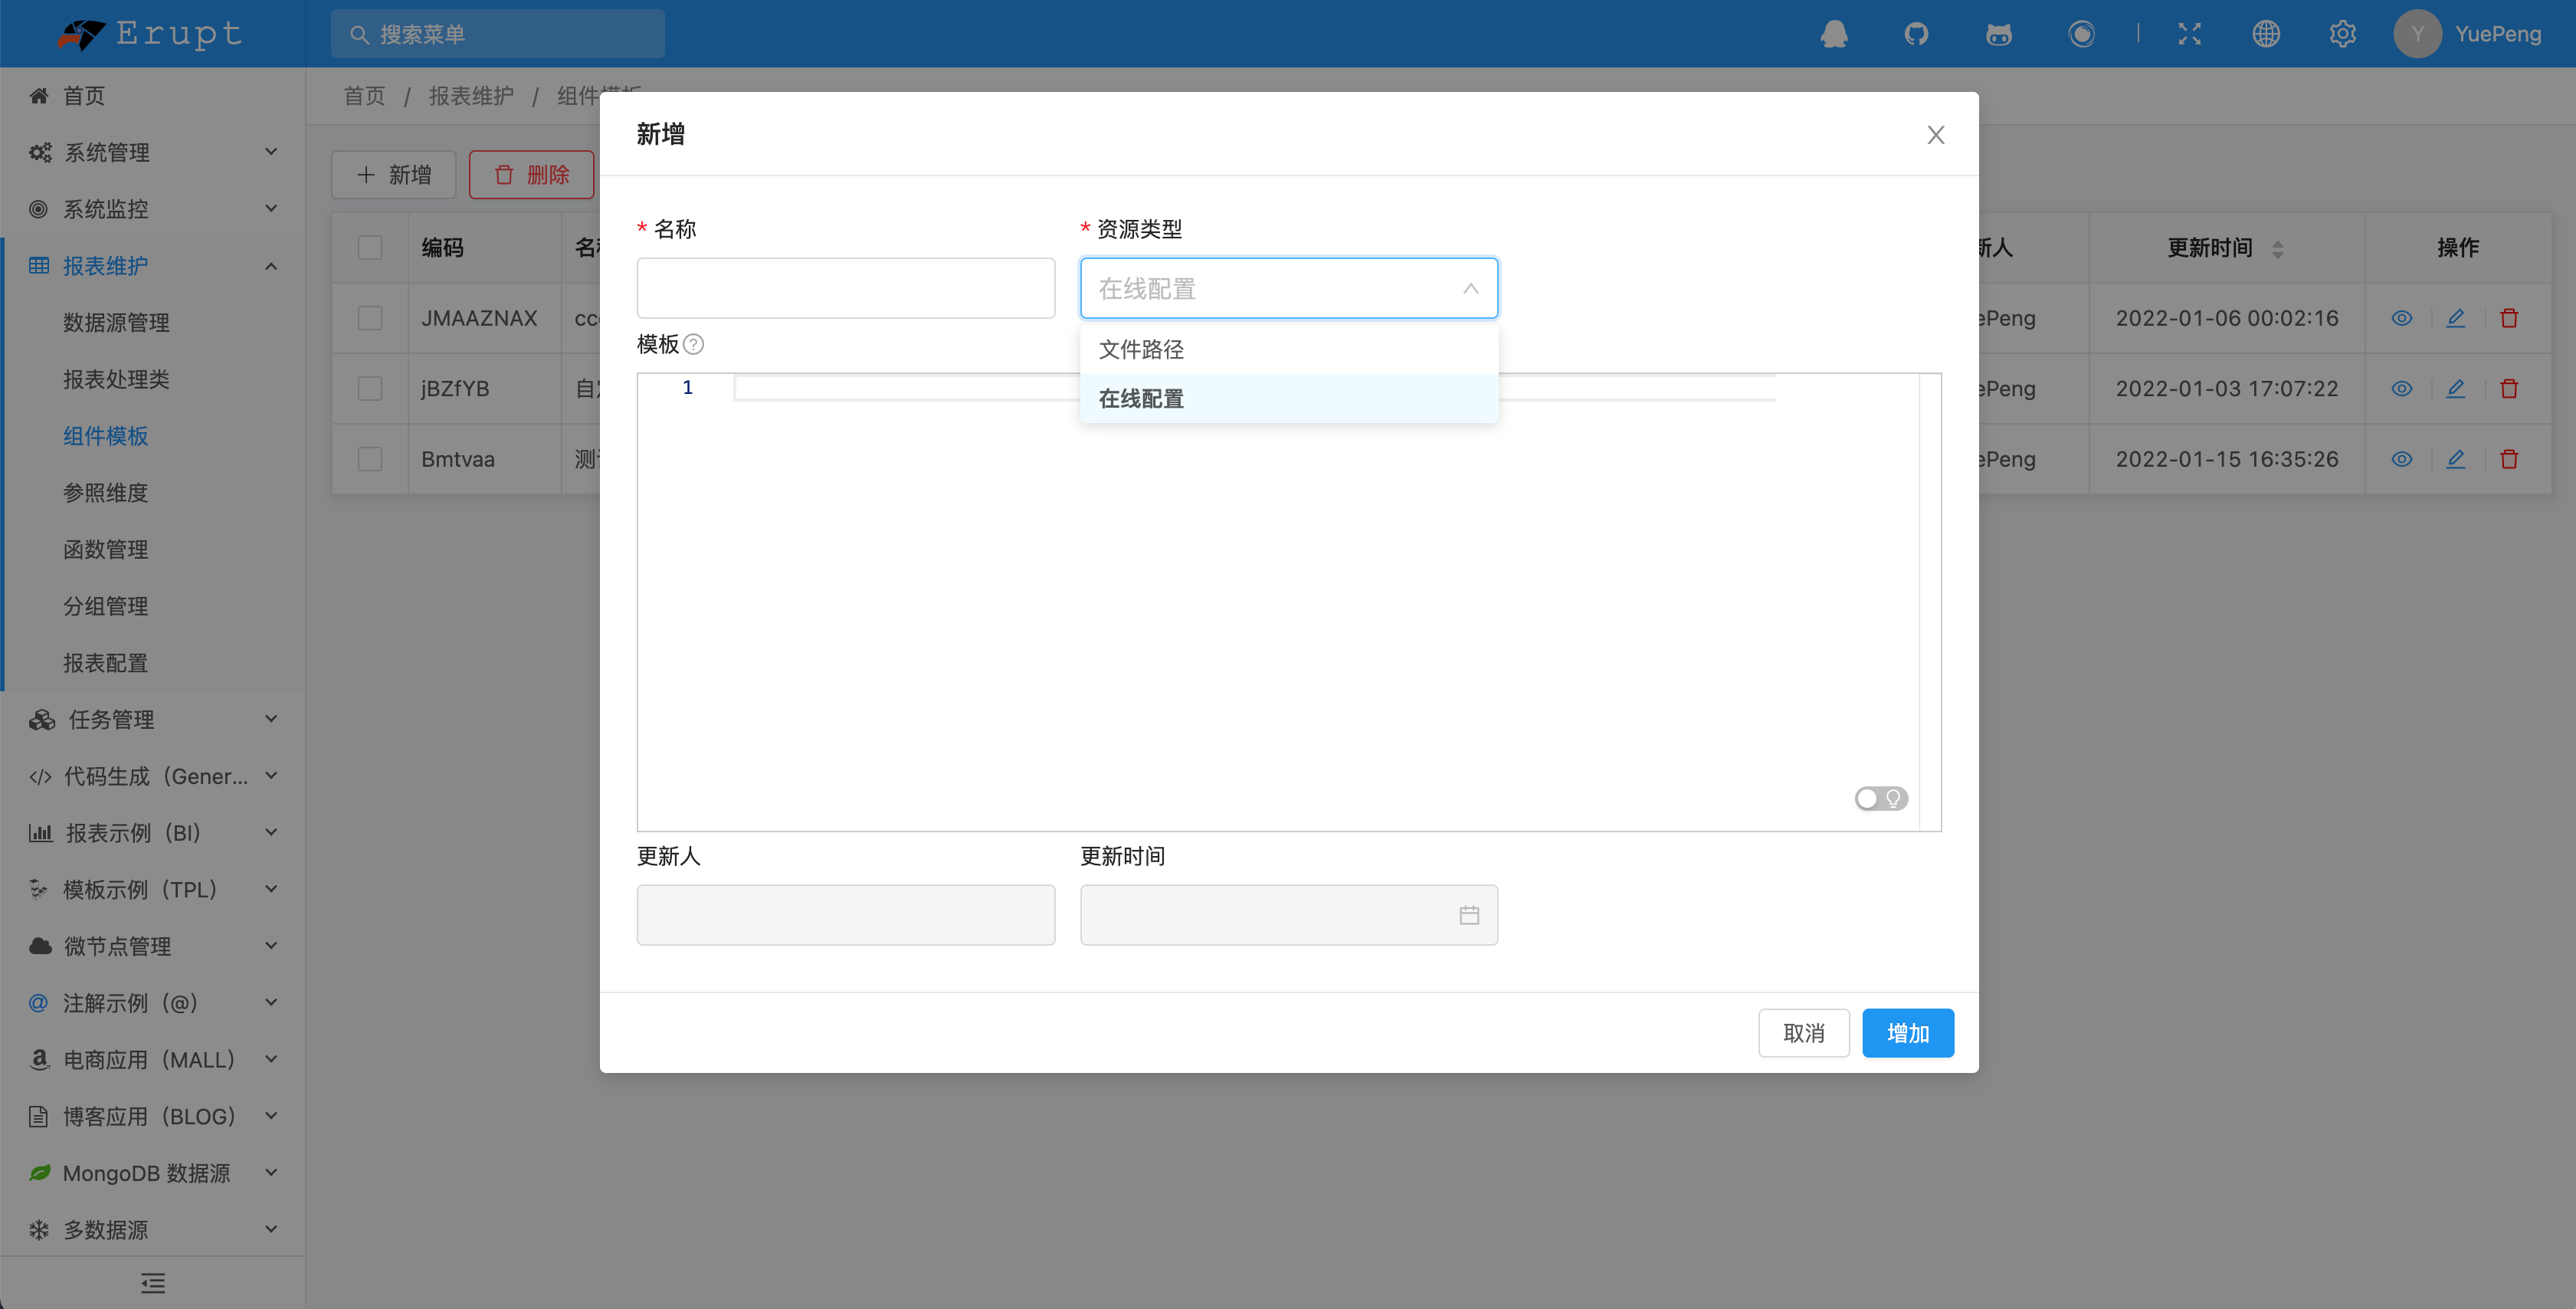
Bind a template via Chart Configuration → select Component Template as the chart type for fully custom report rendering. Templates use Freemarker syntax, with two resource types:
- Online Config — edit the template content online
- File Path — point to a template file under the resources directory
Inside a template, use ${dataJson} (JSON string) or data (List object) to access the chart SQL result, and request for the request object.
<h1>${1+1+100+1000}</h1>
<hr />
<b>bold</b>
<hr/>
<#list data as d>
   ${d.name}
</#list>
<code>
   ${dataJson}
</code>
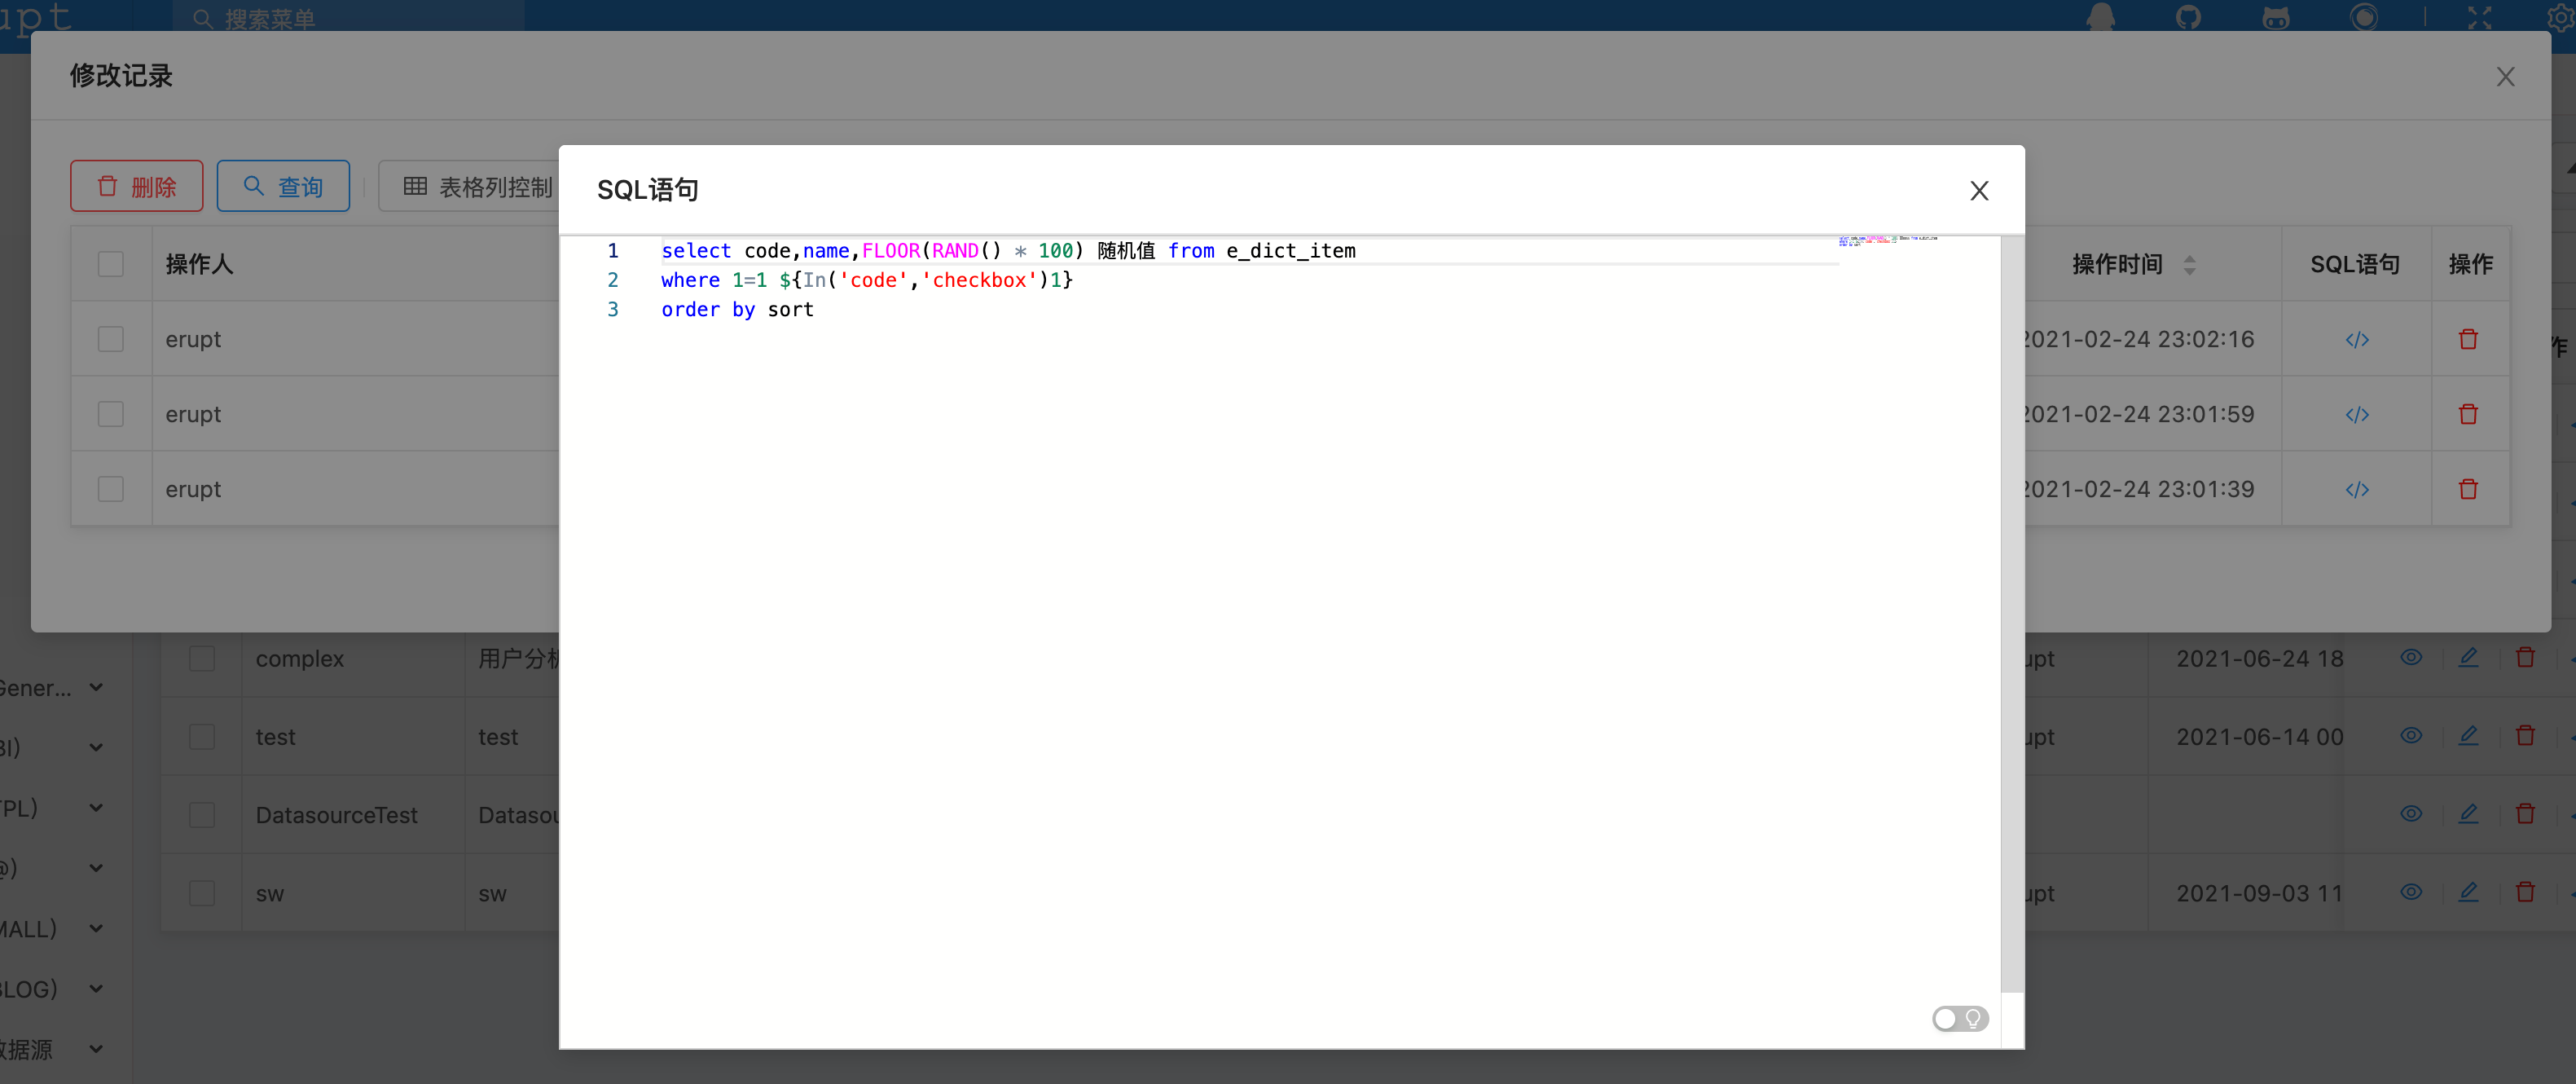
Modification History
Drill into Modification History on a report row to review every change.
Contributors
 YuePeng
 Claude Fable 5.1