
Erupt Monitor Service Monitoring
erupt-monitor provides real-time monitoring of server and application status, including CPU, memory, disk, JVM state & GC diagnostics, HikariCP connection pool, HTTP request statistics, Redis cache and online user management.
Completely rewritten in 2.0.0: a new diagnostics monitoring system covering JVM GC, API connection pool real-time stats, and HTTP request statistics. Upgrading from an older version requires manually deleting the
.eruptdirectory and old "System Monitor" menus before restarting — see the Upgrade Guide.
Adding the Dependency
<dependency>
  <groupId>xyz.erupt</groupId>
  <artifactId>erupt-monitor</artifactId>
  <version>${erupt.version}</version>
</dependency>
After a successful import, restart the application to see the System Monitoring menu entries.
Features
Server Monitoring
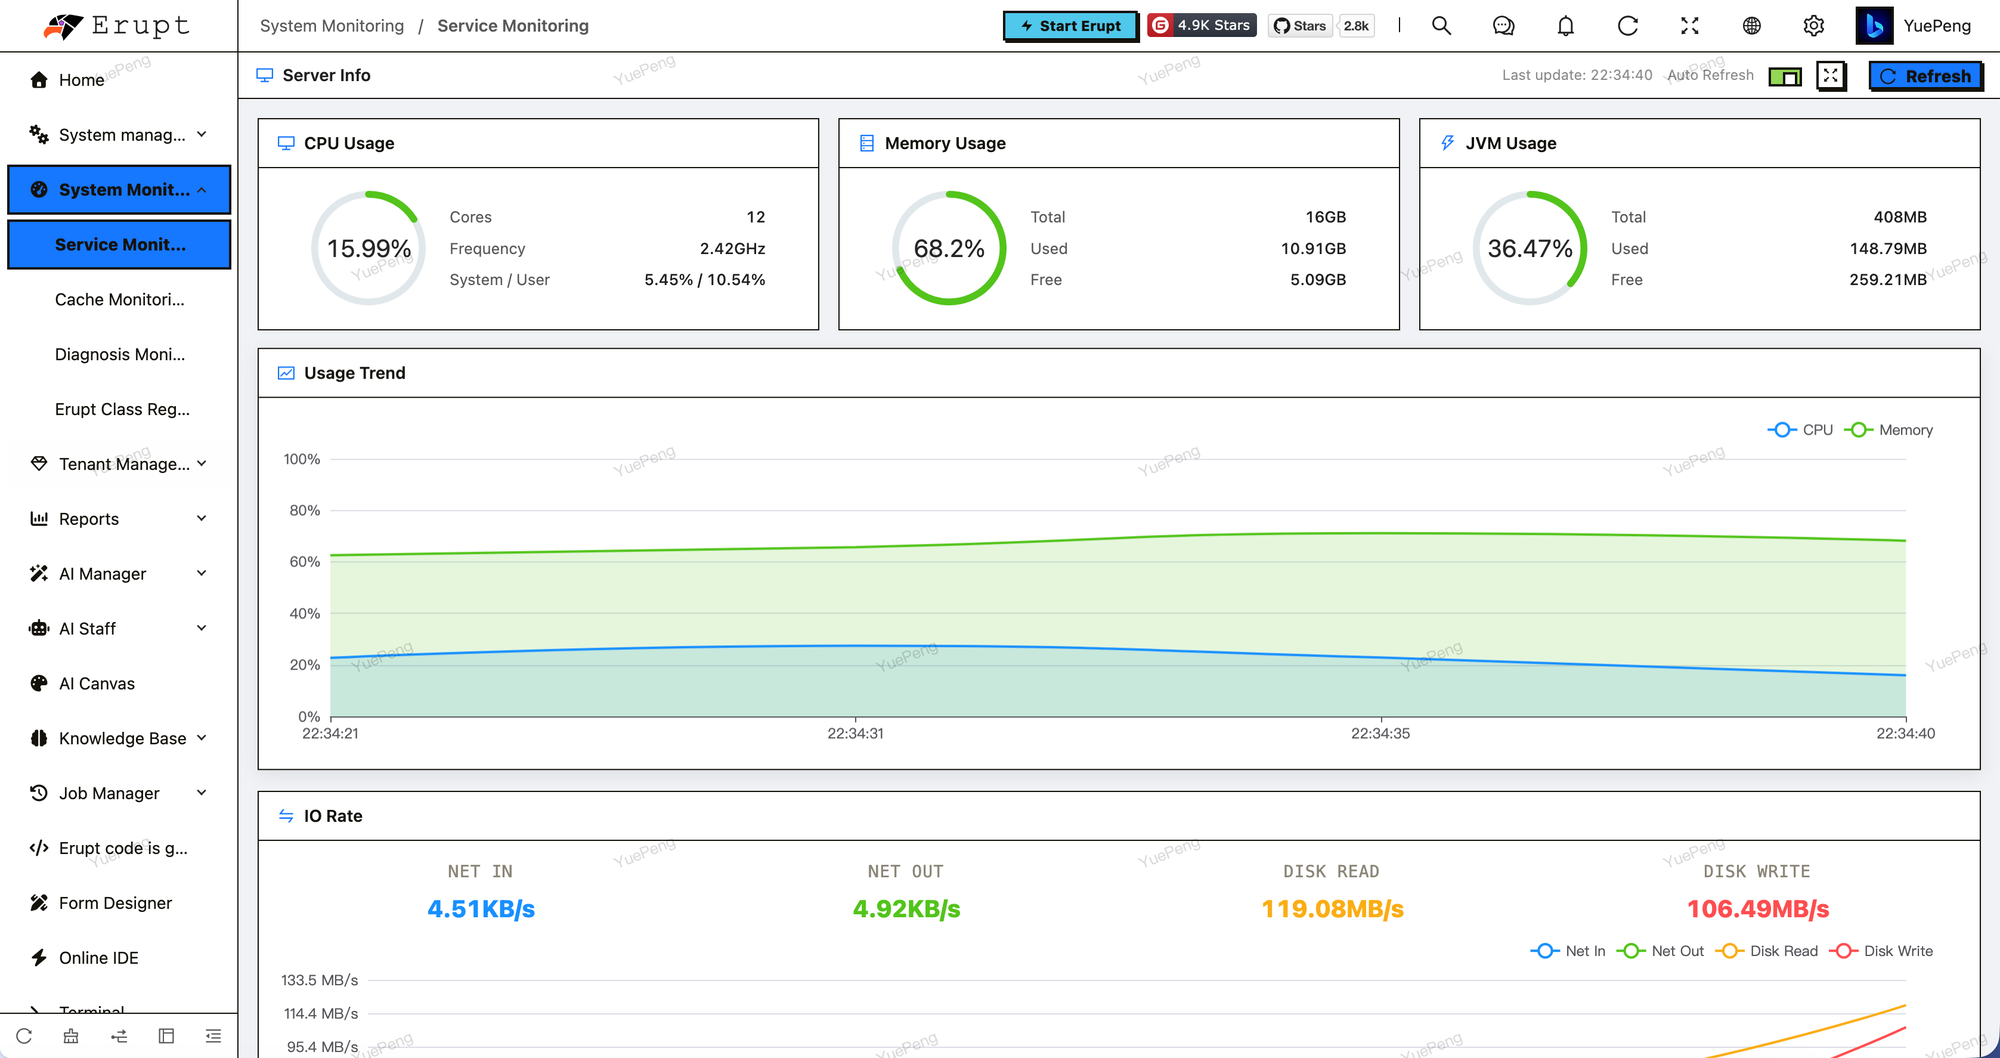
Three ring cards give the current level for CPU, memory and the JVM (cores, frequency, system/user split, total / used / free). Below them, Usage Trend plots CPU and memory second by second, and IO Rate shows live network and disk throughput. Auto refresh, fullscreen and manual refresh sit in the top-right corner.
Diagnosis Monitoring v2.0.0+
Threads, class loading, GC, memory pools, the connection pool and endpoint performance, all on one page:
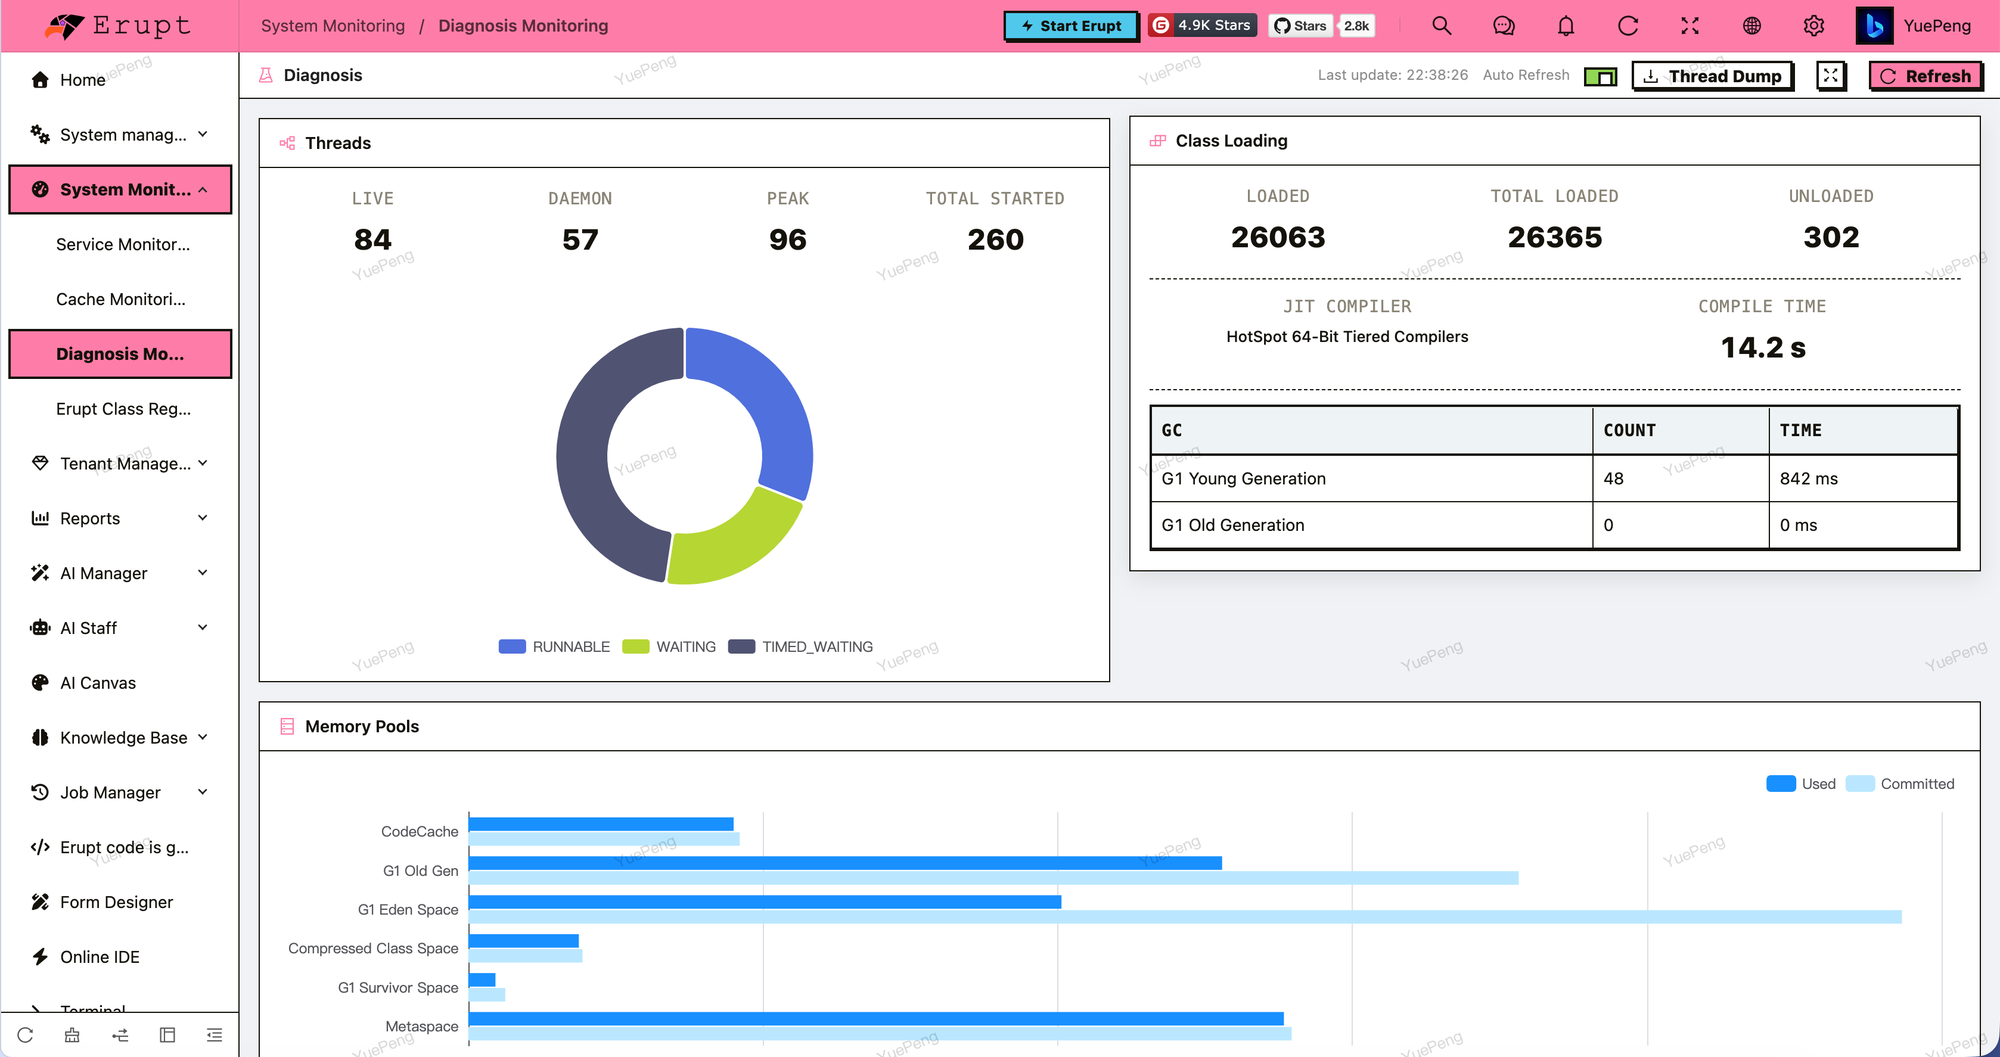
- Threads: live, daemon, peak and total started, plus a
RUNNABLE/WAITING/TIMED_WAITINGdistribution ring — thread pile-ups show up immediately. - Class Loading: currently loaded, total loaded and unloaded classes, along with the JIT compiler and its cumulative compile time.
- GC: collection count and accumulated time per collector (G1 Young / Old Generation and friends).
- Memory Pools:
UsedagainstCommittedfor Metaspace, CodeCache, G1 Eden / Survivor / Old Gen and Compressed Class Space, with a table below listingUSED/COMMITTED/MAXand usage per region; high usage is flagged in red. - Thread Dump: one click in the top-right exports a thread snapshot for chasing deadlocks and thread pile-ups.
Further down, the connection pool and endpoint performance:
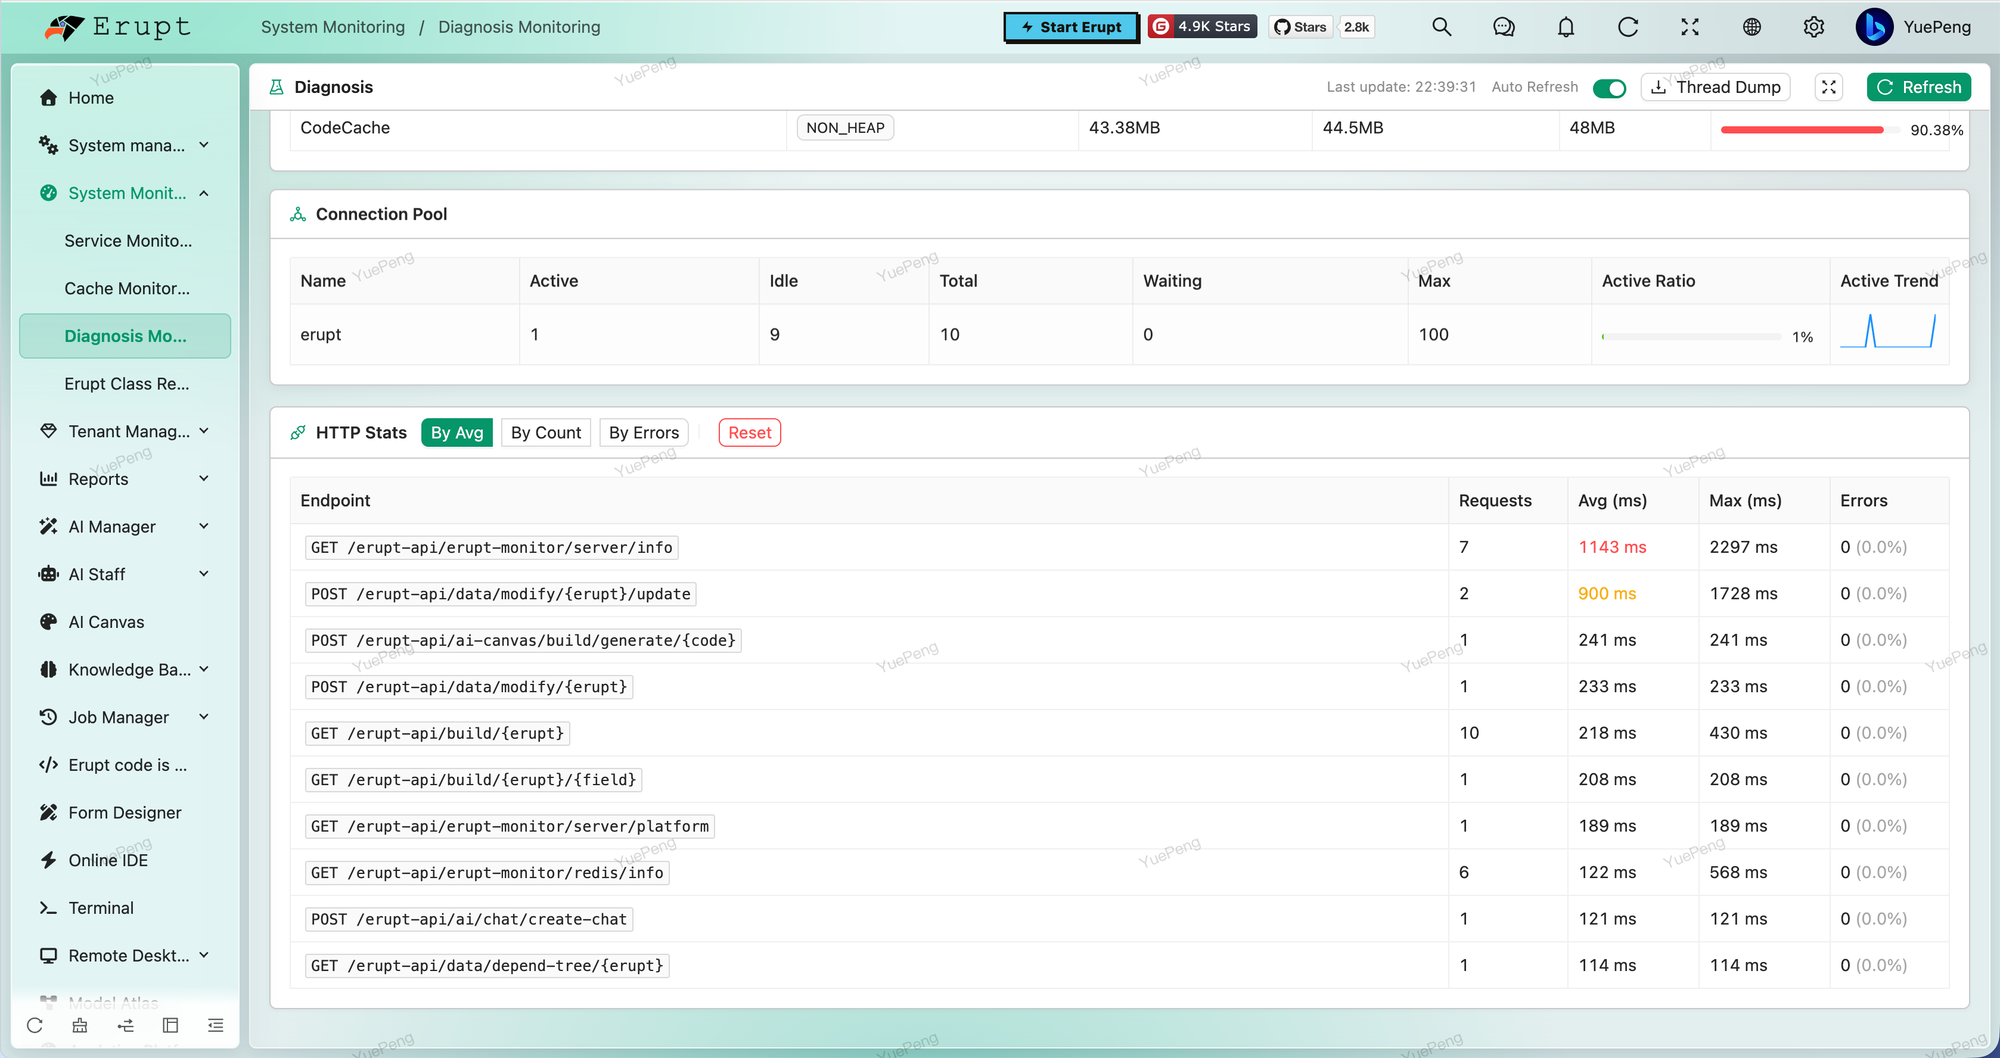
- Connection pool (HikariCP): active, idle, total, waiting, max and active ratio, with a sparkline of the active trend.
- HTTP stats: requests, average and maximum latency and error count (with rate) per endpoint, slow ones highlighted in amber or red. Sort By Avg, By Count or By Errors, and Reset to start counting again.
The Erupt class registry moved to erupt-atlas
From 2.2.0 the Erupt Class Registry and its field drill live in erupt-atlas, next to the model graph under the Model Atlas menu; erupt-monitor keeps only system monitoring. See the upgrade guide for the old menu rows.
Cache Monitoring
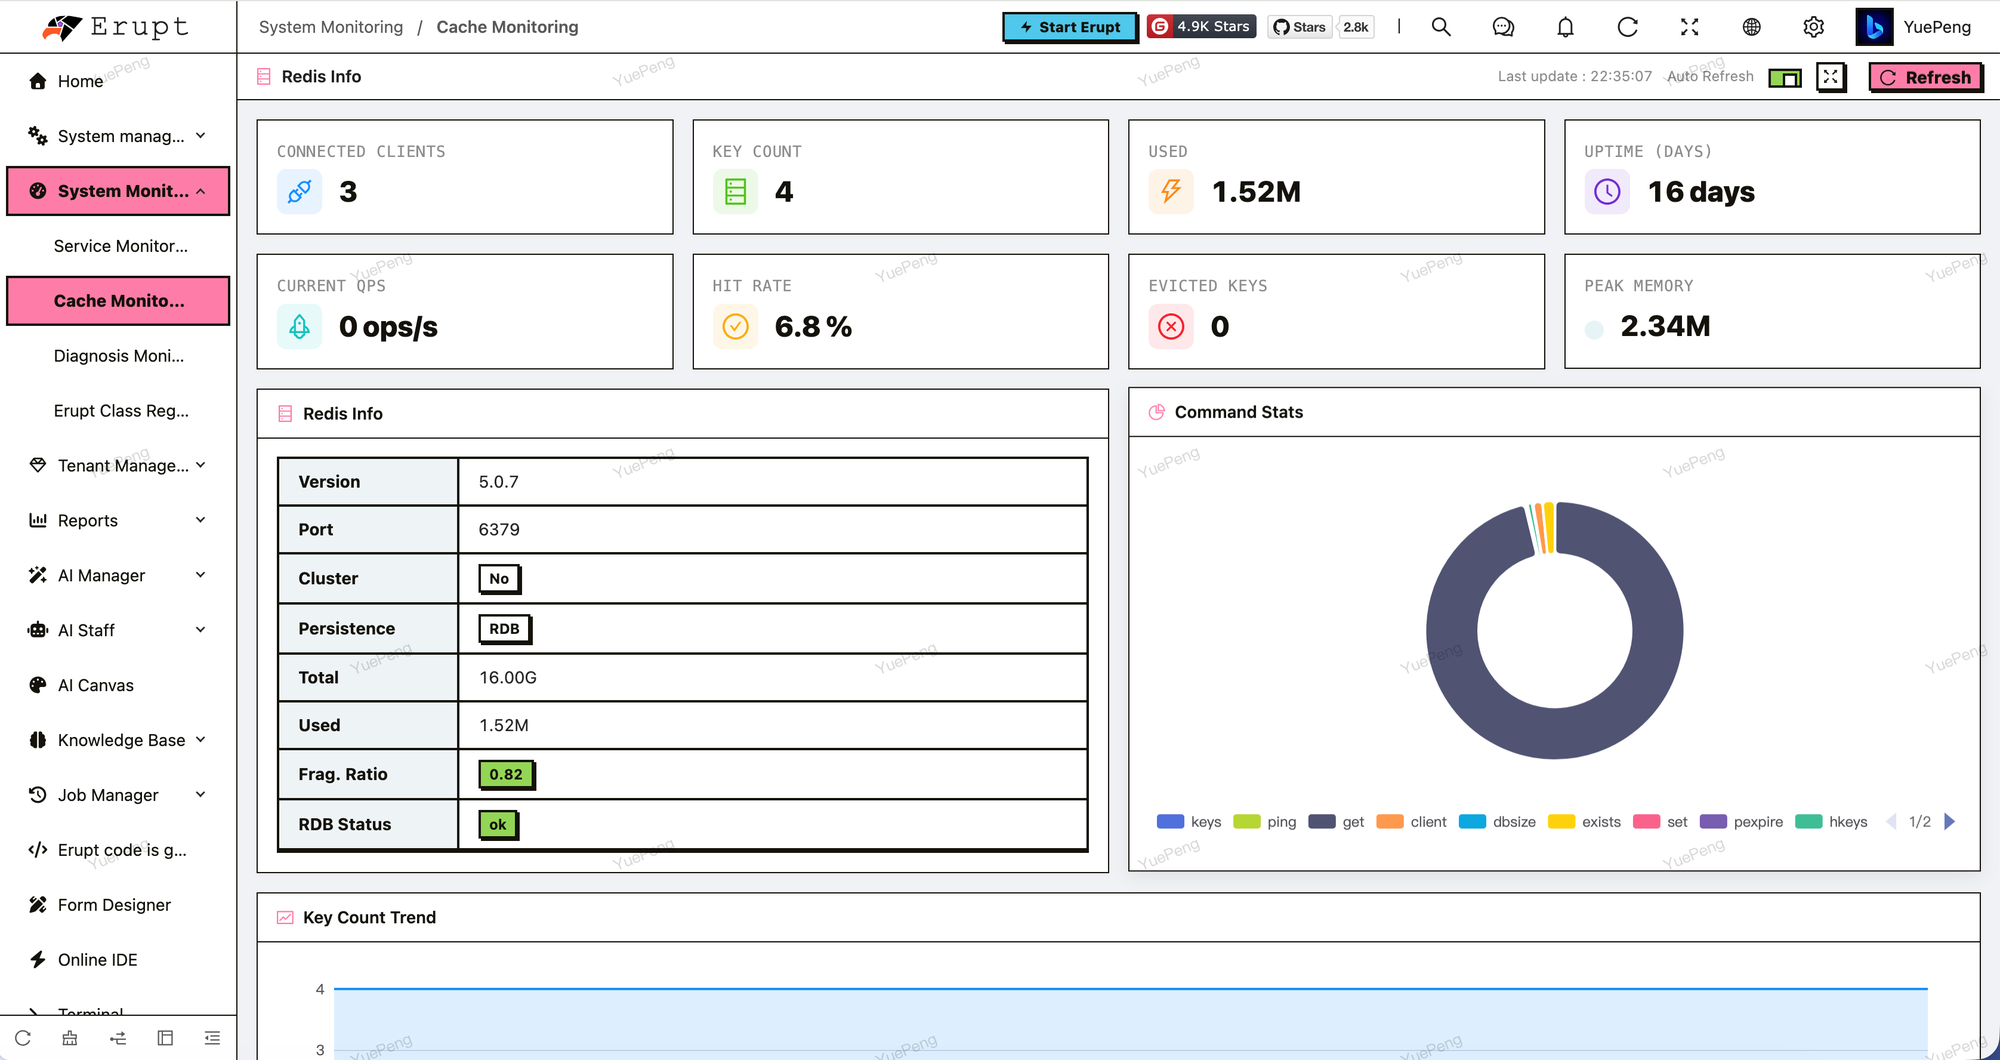
Redis health on a single screen: eight metric cards (connected clients, key count, memory used, uptime in days, current QPS, hit rate, evicted keys, peak memory) alongside the Redis basics (version, port, cluster or not, persistence mode, fragmentation ratio, RDB status), a command distribution chart and a key-count trend.
First configure the Redis connection in application.yml:
spring:
  data:
    redis:
      database: 0
      timeout: 10000
      host: 127.0.0.1
      port: 6379
      password:
WARNING
Since Spring Boot 3, the Redis configuration prefix is spring.data.redis.*. The legacy spring.redis.* prefix no longer works.
Contributors
 YuePeng
 Claude Opus 5 (1M context)