
CUBE View
Puts a grid of charts right into the model's view tabs. The charts query an @EruptCube semantic model from erupt-cube and are declared in code instead of designed on a dashboard. The list's current search conditions are forwarded as cube filters, so the charts always describe the rows being filtered on screen. Used with @Vis(type = Vis.Type.CUBE).
Supported in 2.4.0+, requires the erupt-cube module
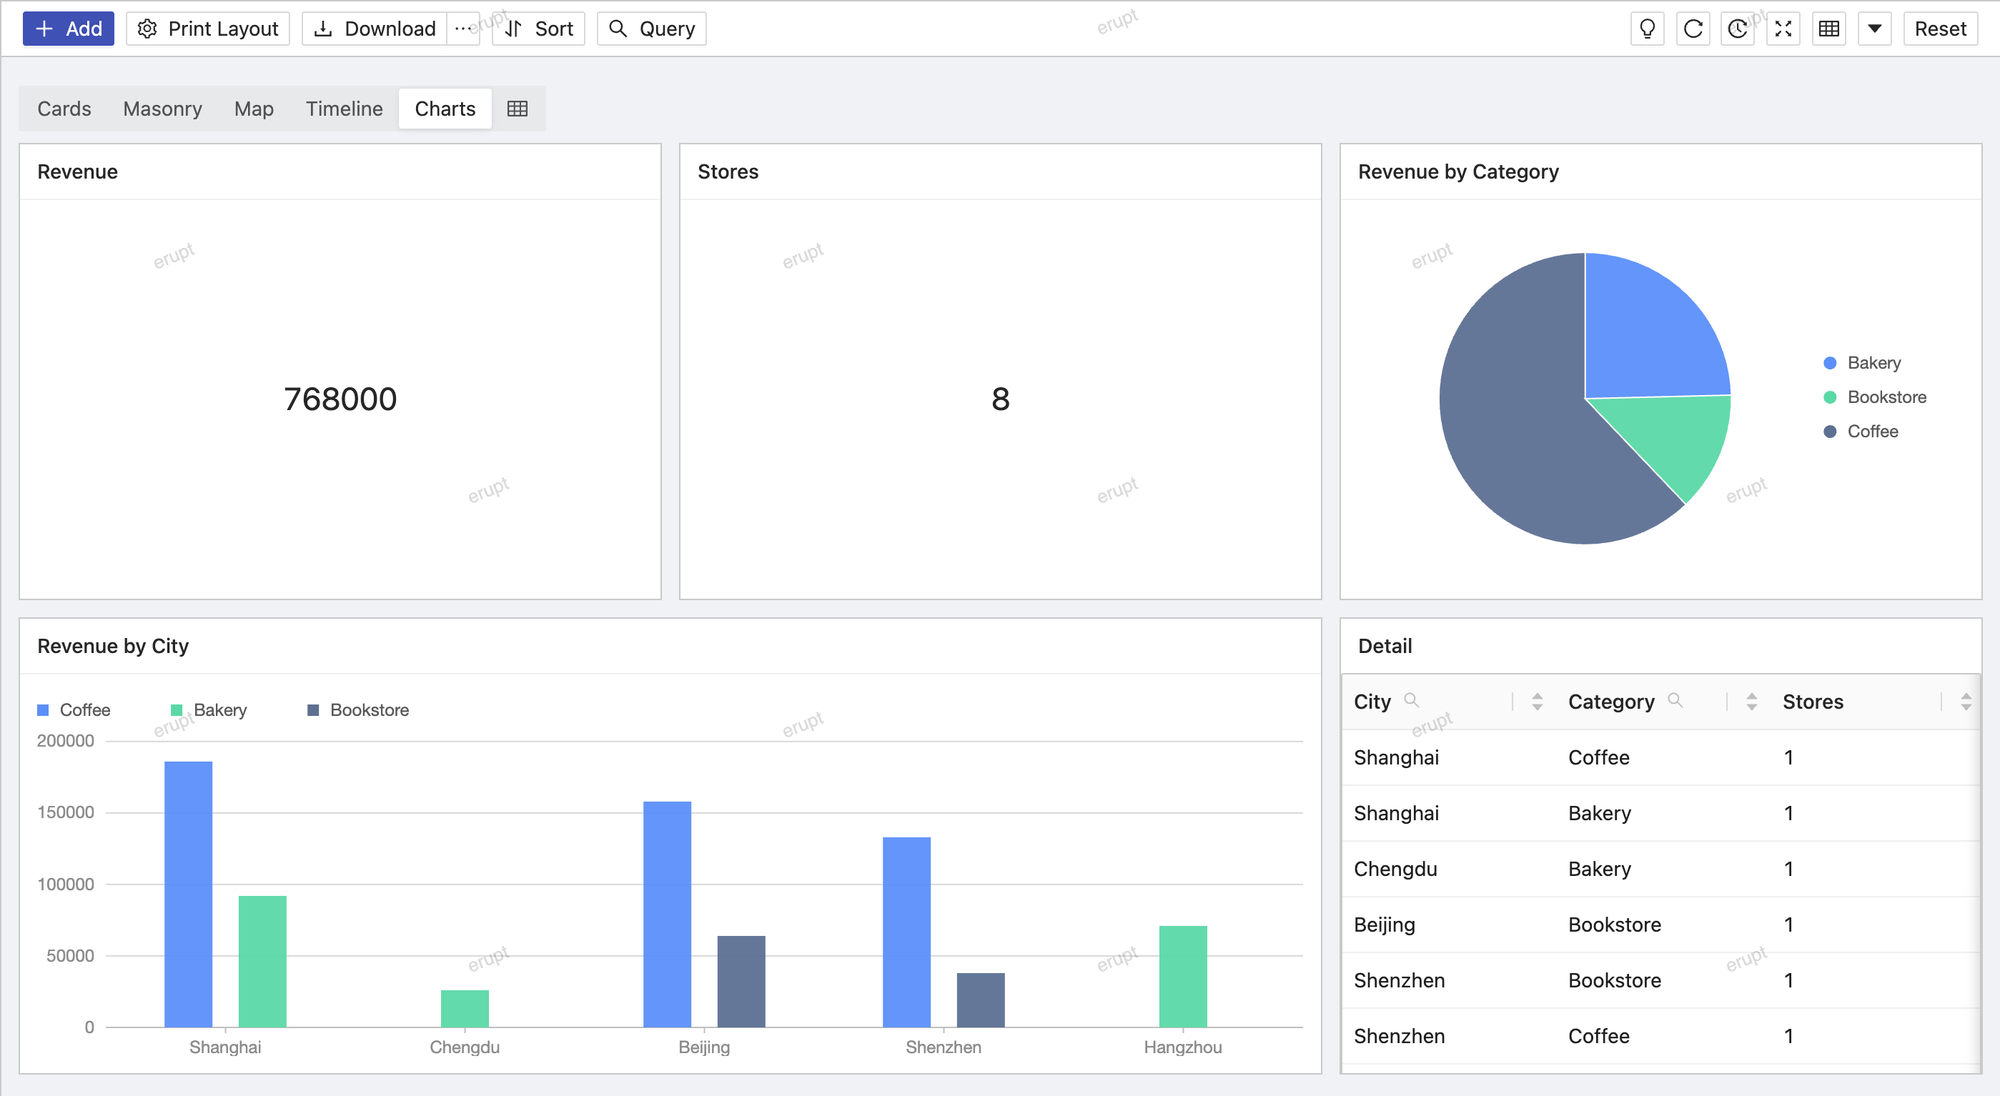
Cube semantic model
See Erupt Cube · Charts in Model Views for the @EruptCube semantic model behind the charts and how they differ from dashboards.
Complete Example
The simplest setup lets the model be its own cube: leave cube at its default Void.class, which means "the annotated model itself".
@Entity
@Table(name = "t_order")
@EruptCube(name = "Order Analysis", sql = "t_order", sqlType = SqlType.TABLE_NAME)
@Erupt(
    name = "Orders",
    vis = {
        @Vis(
            code = "charts",
            title = "Charts",
            type = Vis.Type.CUBE,
            cubeView = @CubeView(
                columns = 2,
                charts = {
                    @CubeChart(title = "Revenue", type = CubeChart.Type.KPI, y = "amount"),
                    @CubeChart(title = "Orders", type = CubeChart.Type.KPI, y = "orders"),
                    @CubeChart(title = "Revenue by Channel", type = CubeChart.Type.COLUMN, x = "channel", y = "amount"),
                    @CubeChart(title = "Category Share", type = CubeChart.Type.PIE, x = "category", y = "amount"),
                    @CubeChart(title = "Revenue Trend", type = CubeChart.Type.LINE,
                               x = "createTime", y = "amount", series = "channel", span = 2)
                }
            )
        )
    }
)
public class Order extends BaseModel {

    @Dimension(title = "Channel")
    @EruptField(
        views = @View(title = "Channel"),
        edit = @Edit(title = "Channel", search = @Search)
    )
    private String channel;

    @Dimension(title = "Category")
    @EruptField(
        views = @View(title = "Category"),
        edit = @Edit(title = "Category", search = @Search)
    )
    private String category;

    @Dimension(title = "Order Time")
    @EruptField(
        views = @View(title = "Order Time"),
        edit = @Edit(title = "Order Time", search = @Search(vague = true))
    )
    private Date createTime;

    @Measure(title = "Revenue", sql = "sum(amount)")
    @EruptField(
        views = @View(title = "Amount"),
        edit = @Edit(title = "Amount")
    )
    private Double amount;

    @Measure(title = "Orders", sql = "count(1)")
    @Transient
    private Long orders;

}
The charts can also be bound to a separate cube class:
@Vis(
    title = "Charts",
    type = Vis.Type.CUBE,
    cubeView = @CubeView(
        cube = OrderCube.class,
        searchMapping = @KV(key = "customer.name", value = "customerName"),
        charts = { ... }
    )
)
@CubeView Attributes
public @interface CubeView {

    Class<?> cube() default Void.class;          // class carrying the @EruptCube to query; Void means this model

    String explore() default Explore.OVERVIEW;   // explore code of the cube

    boolean linkSearch() default true;           // forward the list's search conditions as cube filters

    KV[] searchMapping() default {};             // search field -> cube field when the names differ

    int columns() default 2;                     // charts per row

    int height() default 320;                    // chart height in px

    CubeChart[] charts();                        // the charts (required)

}| Attribute | Description |
|---|---|
cube | Class carrying @EruptCube; the default Void.class means the annotated model, which then carries @EruptCube itself |
explore | Which explore of the cube to query, defaults to overview |
linkSearch | Whether the list's search conditions are forwarded to every chart as cube filters, defaults to true; the searched fields must be dimensions of the cube |
searchMapping | Maps a search field to a cube field when the names differ, e.g. @KV(key = "customer.name", value = "customerName"); unmapped fields are forwarded by their own name |
columns | Charts per grid row, defaults to 2 |
height | Height of each chart, defaults to 320 px |
charts | The chart definitions (required), see @CubeChart below |
@CubeChart Attributes
public @interface CubeChart {

    String title() default "";

    Type type();                 // chart type (required)

    String[] x() default {};     // dimension fields: x axis / category / pivot rows

    String[] y() default {};     // measure fields: y axis / value / pivot values

    String series() default "";  // series dimension: legend / pivot columns / heat map y axis

    int span() default 1;        // grid columns this chart spans

    KV[] ui() default {};        // extra chart options, e.g. color, fontSize for KPI

    enum Type {
        LINE, AREA, BAR, COLUMN, PIE, SCATTER, RADAR, FUNNEL, DUAL_AXES, GAUGE, WATERFALL,
        WORD_CLOUD, ROSE, RADIAL_BAR, SANKEY, CHORD, MAP, BUBBLE, TREEMAP, HEATMAP,
        TINY_LINE, TINY_AREA, TINY_COLUMN, PROGRESS, RING_PROGRESS, TABLE, PIVOT_TABLE, KPI
    }

}| Attribute | Description |
|---|---|
title | Chart title |
type | Chart type (required), mirroring the report types of the erupt-cube dashboard |
x | Dimension fields: the x axis of a line / column chart, the category of a pie, the rows of a pivot table |
y | Measure fields: the y axis, the value, the pivot values; a KPI only needs y |
series | The dimension that splits the data into series: legend, pivot columns, heat map y axis |
span | Grid columns the chart spans, defaults to 1; set it to columns for a full-width chart |
ui | Extra options passed to the chart, e.g. @KV(key = "color", value = "#1890ff") |
A bare field name refers to the view's own cube; a field of a cube joined through @Join is written as OtherCube.field.
Notes
- Whenever the search conditions above the list change, the charts re-query; clicking a chart element (one column of a bar chart, say) adds an equality filter, shown as a removable tag above the charts
- The CUBE view loads the full result set at once and hides the pager
- Rendering and querying are done by the erupt-cube module; without it the view shows a "charts unavailable" empty state and the other views are unaffected
WARNING
With linkSearch = true, every forwarded search field must be declared as a dimension (@Dimension) of the cube, otherwise the cube cannot filter by it. Use searchMapping when the names differ.
Contributors
 YuePeng